| Param | Original file | Final file |
|---|---|---|
| Filename | modeM0/AS1G08_028T01_9000002220cztM0_level2_bc.evt | modeM0/AS1G08_028T01_9000002220cztM0_level2_quad_clean.evt |
| Size (bytes) | 3,080,764,800 | 1,126,152,000 |
| Size | 2.9 GB | 1.0 GB |
| Events in quadrant A | 18,108,781 | 7,125,529 |
| Events in quadrant B | 25,651,175 | 7,238,079 |
| Events in quadrant C | 23,819,459 | 6,957,770 |
| Events in quadrant D | 19,665,147 | 6,697,056 |
| Mode M9 | |||
|---|---|---|---|
| Quadrant | BADHDUFLAG | Total packets | Discarded packets |
| A | 0 | 136 | 0 |
| B | 0 | 136 | 0 |
| C | 0 | 136 | 0 |
| D | 0 | 136 | 0 |
| Mode M0 | |||
|---|---|---|---|
| Quadrant | BADHDUFLAG | Total packets | Discarded packets |
| A | 0 | 183744 | 0 |
| B | 0 | 207943 | 0 |
| C | 0 | 196708 | 0 |
| D | 0 | 190933 | 0 |
| Mode SS | |||
|---|---|---|---|
| Quadrant | BADHDUFLAG | Total packets | Discarded packets |
| A | 0 | 1802 | 0 |
| B | 0 | 1802 | 0 |
| C | 0 | 1802 | 0 |
| D | 0 | 1802 | 0 |
| Quadrant | Total seconds | Saturated seconds | Saturation percentage |
|---|---|---|---|
| A | 88887 | 1263 | 1.420905% |
| B | 88887 | 2912 | 3.276070% |
| C | 88887 | 1435 | 1.614409% |
| D | 88887 | 1723 | 1.938416% |
Noise dominated data is calculated using 1-second bins in cleaned event files. If a bin has >2000 counts, and if more than 50% of those come from <1% of pixels, then it is considered to be noise-dominated and hence unusable.
| Quadrant | # 1 sec bins | Bins with >0 counts | Bins with >2000 counts | High rate bins dominated by noise | Noise dominated (total time) | Noise dominated (detector-on time) | Marked lightcurve |
|---|---|---|---|---|---|---|---|
| A | 102443 | 88880 | 4 | 4 | 0.00% | 0.00% |  |
| B | 102443 | 88879 | 118 | 118 | 0.12% | 0.13% |  |
| C | 102443 | 88880 | 31 | 31 | 0.03% | 0.03% |  |
| D | 102443 | 88882 | 261 | 261 | 0.25% | 0.29% |  |
Top three noisy pixels from each quadrant. If the there are fewer than three noisy pixels in the level2.evt file, extra rows are filled as -1
| Pixel properties | Quadrant properties | ||||||
|---|---|---|---|---|---|---|---|
| Quadrant | DetID | PixID | Counts | Sigma | Mean | Median | Sigma |
| A | 12 | 189 | 309376 | 304.59 | 4617 | 4524 | 1000.8 |
| A | 11 | 29 | 72382 | 67.8 | 4617 | 4524 | 1000.8 |
| A | 0 | 226 | 30408 | 25.86 | 4617 | 4524 | 1000.8 |
| B | 10 | 245 | 4586993 | 5188.94 | 4659 | 4536 | 883.1 |
| B | 3 | 64 | 3135423 | 3545.25 | 4659 | 4536 | 883.1 |
| B | 0 | 229 | 122641 | 133.74 | 4659 | 4536 | 883.1 |
| C | 3 | 233 | 4054786 | 4099.4 | 4506 | 4447 | 988.0 |
| C | 4 | 254 | 1023822 | 1031.72 | 4506 | 4447 | 988.0 |
| C | 3 | 9 | 990533 | 998.03 | 4506 | 4447 | 988.0 |
| D | 9 | 1 | 1577593 | 1507.23 | 4510 | 4345 | 1043.8 |
| D | 10 | 70 | 434024 | 411.65 | 4510 | 4345 | 1043.8 |
| D | 2 | 234 | 318961 | 301.41 | 4510 | 4345 | 1043.8 |
Histogram calculated using DETX and DETY for each event in the final _common_clean file
| Quadrant A |  |
 |
Quadrant B |
|---|---|---|---|
| Quadrant D |  |
 |
Quadrant C |
| Plot type | Count rate plots | Images |
|---|---|---|
| Comparison with Poisson distribution Blue bars denote a histogram of data divided into 1 sec bins. Red curve is a Poisson curve with rate = median count rate of data. |
 |
 |
| Quadrant-wise count rates Data is divided into 100 sec bins |
 |
|
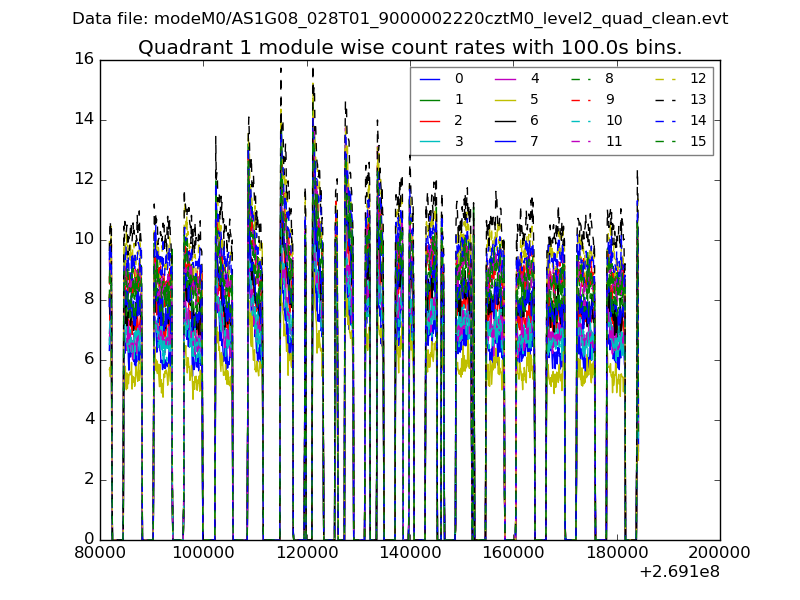
| Module-wise count rates for Quadrant A Data is divided into 100 sec bins |
 |
 |
| Module-wise count rates for Quadrant B Data is divided into 100 sec bins |
 |
 |
| Module-wise count rates for Quadrant C Data is divided into 100 sec bins |
 |
 |
| Module-wise count rates for Quadrant D Data is divided into 100 sec bins |
 |
 |
| Parameter | Plot |
|---|---|
| CZT HV Monitor |  |
| D_VDD |  |
| Temperature 1 |  |
| Veto HV Monitor |  |
| Veto LLD |  |
| Alpha Counter |  |
| _CPM_Rate |  |
| CZT Counter |  |
| +2.5 Volts monitor |  |
| +5 Volts monitor |  |
| _ROLL_ROT |  |
| _Roll_DEC |  |
| _Roll_RA | 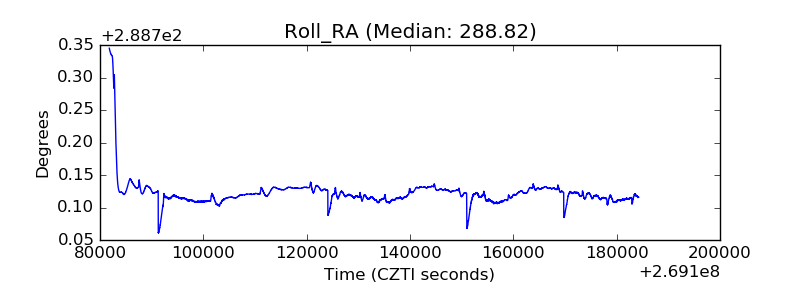 |
| Veto Counter |  |