| Param | Original file | Final file |
|---|---|---|
| Filename | modeM0/AS1A04_218T03_9000002214cztM0_level2_bc.evt | modeM0/AS1A04_218T03_9000002214cztM0_level2_quad_clean.evt |
| Size (bytes) | 1,093,740,480 | 412,761,600 |
| Size | 1.0 GB | 393.6 MB |
| Events in quadrant A | 7,265,279 | 2,609,444 |
| Events in quadrant B | 8,525,426 | 2,639,930 |
| Events in quadrant C | 8,089,098 | 2,601,152 |
| Events in quadrant D | 7,108,582 | 2,503,471 |
| Mode M9 | |||
|---|---|---|---|
| Quadrant | BADHDUFLAG | Total packets | Discarded packets |
| A | 0 | 49 | 0 |
| B | 0 | 49 | 0 |
| C | 0 | 49 | 0 |
| D | 0 | 49 | 0 |
| Mode M0 | |||
|---|---|---|---|
| Quadrant | BADHDUFLAG | Total packets | Discarded packets |
| A | 0 | 69118 | 0 |
| B | 0 | 74164 | 0 |
| C | 0 | 68533 | 0 |
| D | 0 | 66919 | 0 |
| Mode SS | |||
|---|---|---|---|
| Quadrant | BADHDUFLAG | Total packets | Discarded packets |
| A | 0 | 640 | 0 |
| B | 0 | 640 | 0 |
| C | 0 | 640 | 0 |
| D | 0 | 640 | 0 |
| Quadrant | Total seconds | Saturated seconds | Saturation percentage |
|---|---|---|---|
| A | 31256 | 269 | 0.860635% |
| B | 31256 | 1230 | 3.935244% |
| C | 31256 | 185 | 0.591886% |
| D | 31256 | 273 | 0.873432% |
Noise dominated data is calculated using 1-second bins in cleaned event files. If a bin has >2000 counts, and if more than 50% of those come from <1% of pixels, then it is considered to be noise-dominated and hence unusable.
| Quadrant | # 1 sec bins | Bins with >0 counts | Bins with >2000 counts | High rate bins dominated by noise | Noise dominated (total time) | Noise dominated (detector-on time) | Marked lightcurve |
|---|---|---|---|---|---|---|---|
| A | 36243 | 31256 | 4 | 4 | 0.01% | 0.01% |  |
| B | 36243 | 31254 | 75 | 75 | 0.21% | 0.24% |  |
| C | 36243 | 31257 | 0 | 0 | 0.00% | 0.00% |  |
| D | 36243 | 31255 | 7 | 7 | 0.02% | 0.02% |  |
Top three noisy pixels from each quadrant. If the there are fewer than three noisy pixels in the level2.evt file, extra rows are filled as -1
| Pixel properties | Quadrant properties | ||||||
|---|---|---|---|---|---|---|---|
| Quadrant | DetID | PixID | Counts | Sigma | Mean | Median | Sigma |
| A | 12 | 189 | 495420 | 1415.56 | 1586 | 1550 | 348.9 |
| A | 1 | 162 | 280145 | 798.52 | 1586 | 1550 | 348.9 |
| A | 2 | 79 | 210662 | 599.37 | 1586 | 1550 | 348.9 |
| B | 3 | 64 | 1433640 | 4790.48 | 1581 | 1538 | 298.9 |
| B | 10 | 16 | 549557 | 1833.16 | 1581 | 1538 | 298.9 |
| B | 0 | 229 | 134668 | 445.33 | 1581 | 1538 | 298.9 |
| C | 3 | 233 | 1963587 | 5690.69 | 1557 | 1535 | 344.8 |
| C | 3 | 232 | 18025 | 47.83 | 1557 | 1535 | 344.8 |
| C | 3 | 234 | 12186 | 30.89 | 1557 | 1535 | 344.8 |
| D | 2 | 136 | 338264 | 939.53 | 1569 | 1514 | 358.4 |
| D | 12 | 235 | 225053 | 623.67 | 1569 | 1514 | 358.4 |
| D | 2 | 234 | 109928 | 302.48 | 1569 | 1514 | 358.4 |
Histogram calculated using DETX and DETY for each event in the final _common_clean file
| Quadrant A |  |
 |
Quadrant B |
|---|---|---|---|
| Quadrant D |  |
 |
Quadrant C |
| Plot type | Count rate plots | Images |
|---|---|---|
| Comparison with Poisson distribution Blue bars denote a histogram of data divided into 1 sec bins. Red curve is a Poisson curve with rate = median count rate of data. |
 |
 |
| Quadrant-wise count rates Data is divided into 100 sec bins |
 |
|
| Module-wise count rates for Quadrant A Data is divided into 100 sec bins |
 |
 |
| Module-wise count rates for Quadrant B Data is divided into 100 sec bins |
 |
 |
| Module-wise count rates for Quadrant C Data is divided into 100 sec bins |
 |
 |
| Module-wise count rates for Quadrant D Data is divided into 100 sec bins |
 |
 |
| Parameter | Plot |
|---|---|
| CZT HV Monitor |  |
| D_VDD |  |
| Temperature 1 |  |
| Veto HV Monitor |  |
| Veto LLD |  |
| Alpha Counter |  |
| _CPM_Rate | 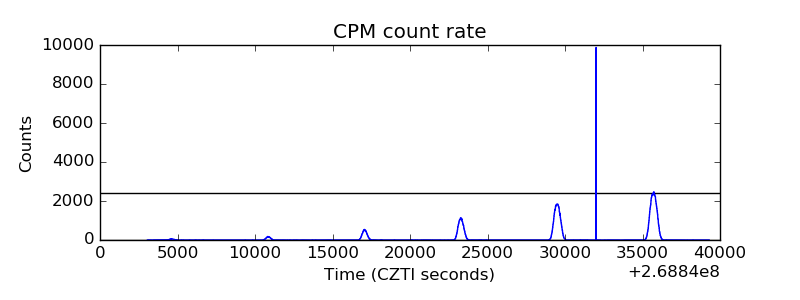 |
| CZT Counter |  |
| +2.5 Volts monitor |  |
| +5 Volts monitor |  |
| _ROLL_ROT | 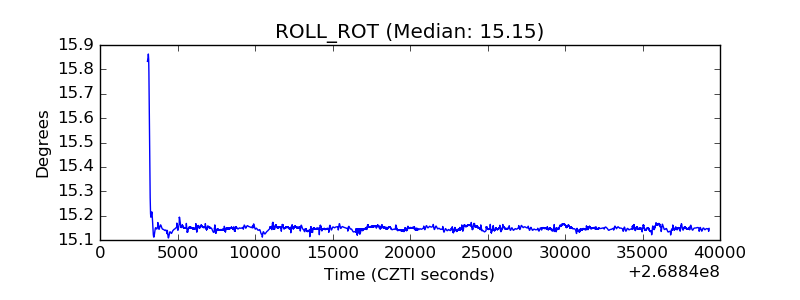 |
| _Roll_DEC |  |
| _Roll_RA |  |
| Veto Counter |  |