| Param | Original file | Final file |
|---|---|---|
| Filename | modeM0/AS1T02_057T01_9000002212cztM0_level2_bc.evt | modeM0/AS1T02_057T01_9000002212cztM0_level2_quad_clean.evt |
| Size (bytes) | 3,213,299,520 | 1,291,464,000 |
| Size | 3.0 GB | 1.2 GB |
| Events in quadrant A | 21,979,623 | 8,333,414 |
| Events in quadrant B | 25,977,950 | 8,355,405 |
| Events in quadrant C | 21,282,207 | 8,243,373 |
| Events in quadrant D | 21,866,151 | 7,939,734 |
| Mode M9 | |||
|---|---|---|---|
| Quadrant | BADHDUFLAG | Total packets | Discarded packets |
| A | 0 | 128 | 0 |
| B | 0 | 128 | 0 |
| C | 0 | 128 | 0 |
| D | 0 | 128 | 0 |
| Mode SS | |||
|---|---|---|---|
| Quadrant | BADHDUFLAG | Total packets | Discarded packets |
| A | 0 | 1852 | 0 |
| B | 0 | 1852 | 0 |
| C | 0 | 1852 | 0 |
| D | 0 | 1852 | 0 |
| Mode M0 | |||
|---|---|---|---|
| Quadrant | BADHDUFLAG | Total packets | Discarded packets |
| A | 0 | 210414 | 0 |
| B | 0 | 213062 | 0 |
| C | 0 | 192486 | 0 |
| D | 0 | 198691 | 0 |
| Quadrant | Total seconds | Saturated seconds | Saturation percentage |
|---|---|---|---|
| A | 91143 | 1687 | 1.850938% |
| B | 91142 | 3391 | 3.720568% |
| C | 91143 | 1175 | 1.289183% |
| D | 91143 | 1589 | 1.743414% |
Noise dominated data is calculated using 1-second bins in cleaned event files. If a bin has >2000 counts, and if more than 50% of those come from <1% of pixels, then it is considered to be noise-dominated and hence unusable.
| Quadrant | # 1 sec bins | Bins with >0 counts | Bins with >2000 counts | High rate bins dominated by noise | Noise dominated (total time) | Noise dominated (detector-on time) | Marked lightcurve |
|---|---|---|---|---|---|---|---|
| A | 103699 | 91146 | 13 | 13 | 0.01% | 0.01% |  |
| B | 103699 | 91132 | 447 | 447 | 0.43% | 0.49% |  |
| C | 103699 | 91145 | 29 | 29 | 0.03% | 0.03% |  |
| D | 103699 | 91147 | 206 | 206 | 0.20% | 0.23% |  |
Top three noisy pixels from each quadrant. If the there are fewer than three noisy pixels in the level2.evt file, extra rows are filled as -1
| Pixel properties | Quadrant properties | ||||||
|---|---|---|---|---|---|---|---|
| Quadrant | DetID | PixID | Counts | Sigma | Mean | Median | Sigma |
| A | 1 | 162 | 1381792 | 1368.72 | 4614 | 4533 | 1006.2 |
| A | 15 | 239 | 1116348 | 1104.92 | 4614 | 4533 | 1006.2 |
| A | 12 | 189 | 1005806 | 995.06 | 4614 | 4533 | 1006.2 |
| B | 3 | 64 | 3299611 | 3819.62 | 4617 | 4504 | 862.7 |
| B | 10 | 16 | 2405389 | 2783.05 | 4617 | 4504 | 862.7 |
| B | 0 | 229 | 1158708 | 1337.93 | 4617 | 4504 | 862.7 |
| C | 3 | 233 | 2443436 | 2481.22 | 4477 | 4421 | 983.0 |
| C | 9 | 236 | 1165776 | 1181.45 | 4477 | 4421 | 983.0 |
| C | 0 | 207 | 75711 | 72.52 | 4477 | 4421 | 983.0 |
| D | 7 | 223 | 1181257 | 1131.57 | 4519 | 4366 | 1040.1 |
| D | 2 | 136 | 941629 | 901.17 | 4519 | 4366 | 1040.1 |
| D | 10 | 70 | 446297 | 424.91 | 4519 | 4366 | 1040.1 |
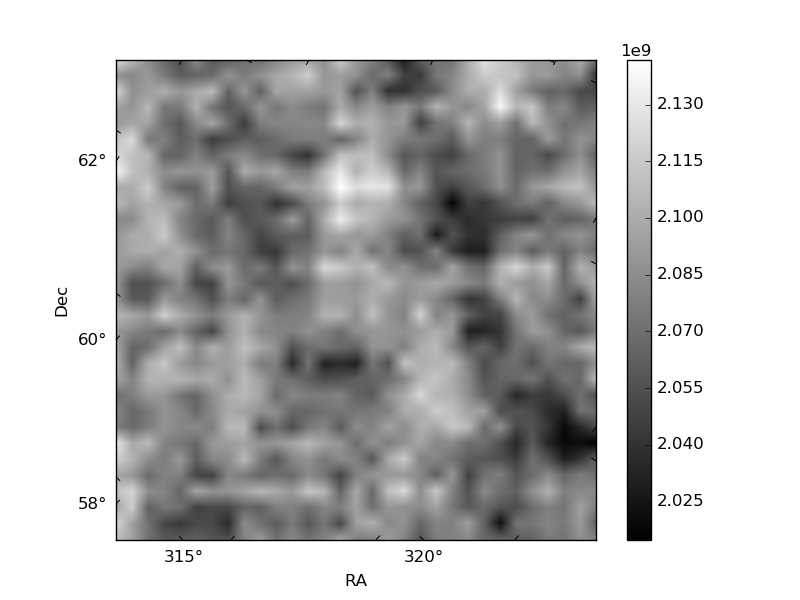
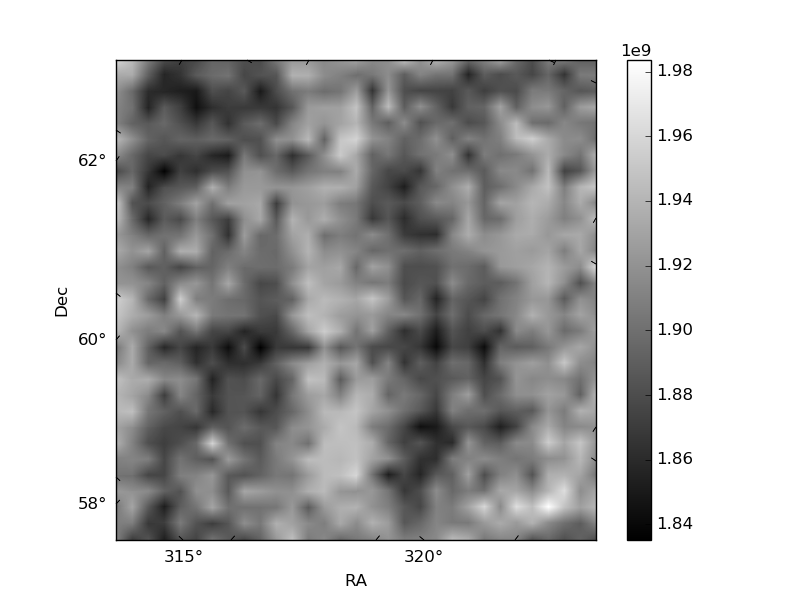
Histogram calculated using DETX and DETY for each event in the final _common_clean file
| Quadrant A |  |
 |
Quadrant B |
|---|---|---|---|
| Quadrant D | 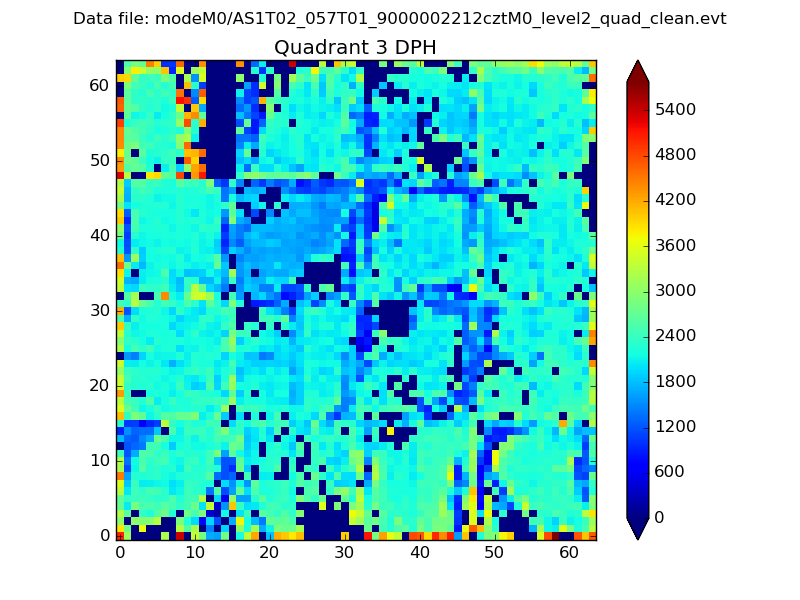 |
 |
Quadrant C |
| Plot type | Count rate plots | Images |
|---|---|---|
| Comparison with Poisson distribution Blue bars denote a histogram of data divided into 1 sec bins. Red curve is a Poisson curve with rate = median count rate of data. |
 |
 |
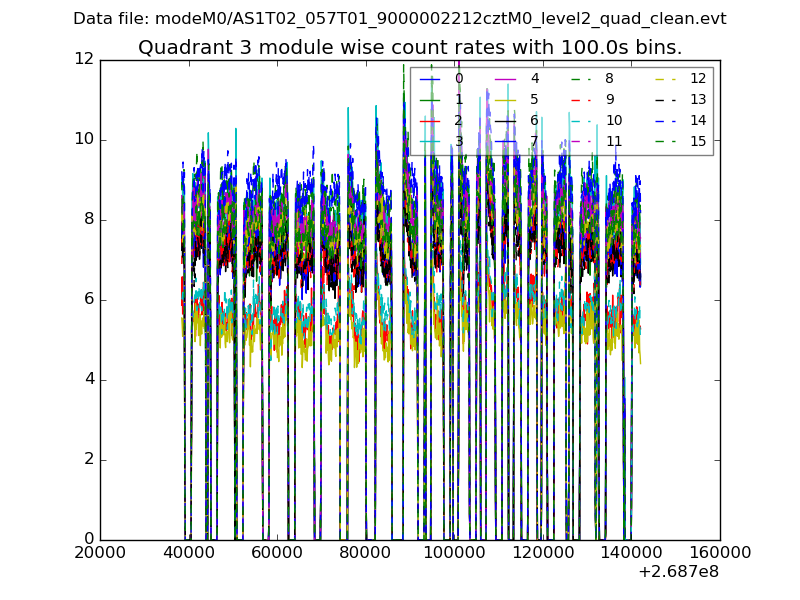
| Quadrant-wise count rates Data is divided into 100 sec bins |
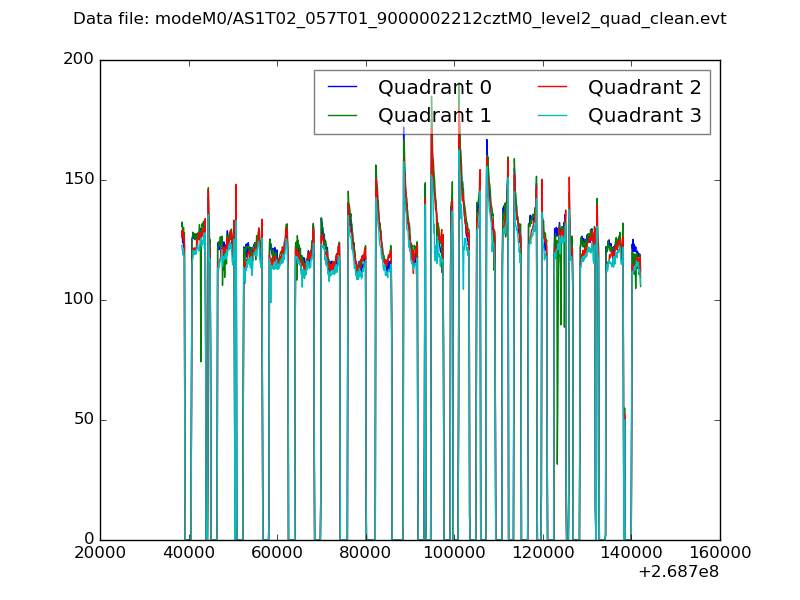 |
|
| Module-wise count rates for Quadrant A Data is divided into 100 sec bins |
 |
 |
| Module-wise count rates for Quadrant B Data is divided into 100 sec bins |
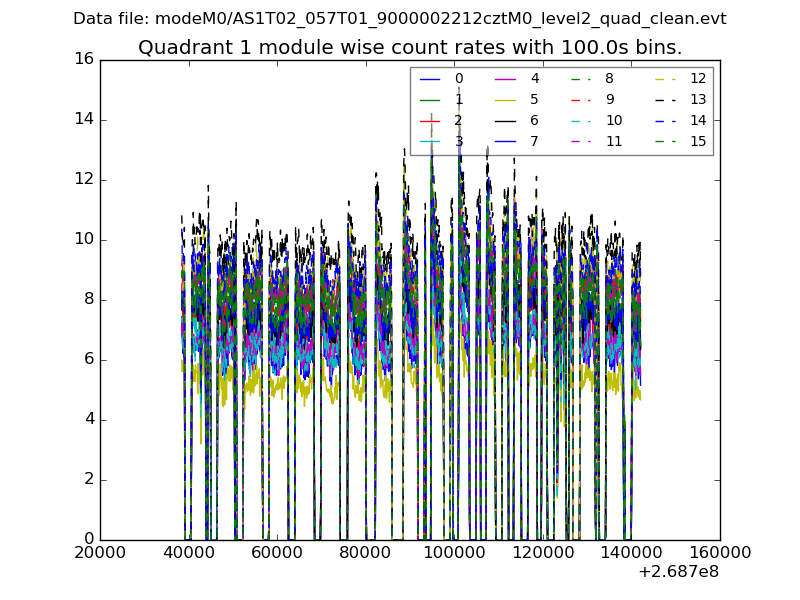 |
 |
| Module-wise count rates for Quadrant C Data is divided into 100 sec bins |
 |
 |
| Module-wise count rates for Quadrant D Data is divided into 100 sec bins |
 |
 |
| Parameter | Plot |
|---|---|
| CZT HV Monitor |  |
| D_VDD |  |
| Temperature 1 |  |
| Veto HV Monitor |  |
| Veto LLD |  |
| Alpha Counter | 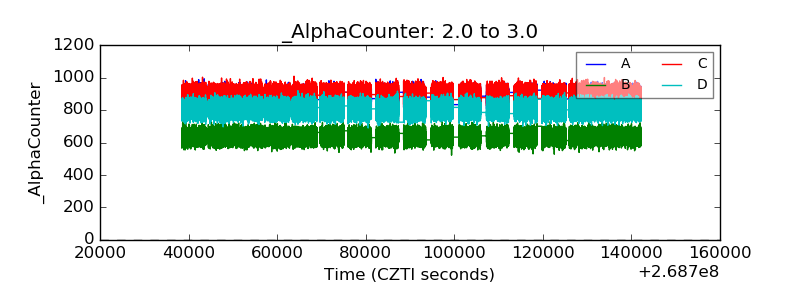 |
| _CPM_Rate |  |
| CZT Counter |  |
| +2.5 Volts monitor | 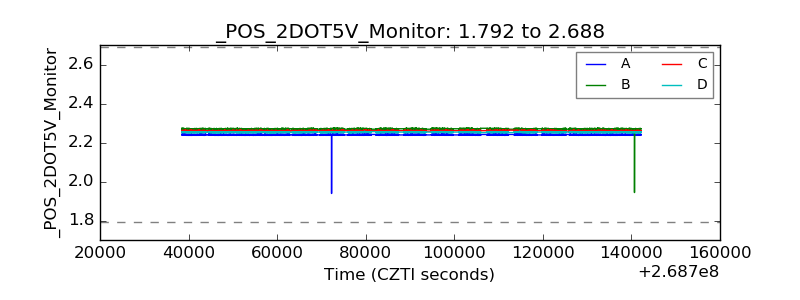 |
| +5 Volts monitor |  |
| _ROLL_ROT |  |
| _Roll_DEC |  |
| _Roll_RA |  |
| Veto Counter |  |