| Param | Original file | Final file |
|---|---|---|
| Filename | modeM0/AS1T02_052T01_9000002208cztM0_level2_bc.evt | modeM0/AS1T02_052T01_9000002208cztM0_level2_quad_clean.evt |
| Size (bytes) | 1,289,537,280 | 313,623,360 |
| Size | 1.2 GB | 299.1 MB |
| Events in quadrant A | 5,441,381 | 2,002,773 |
| Events in quadrant B | 8,228,274 | 1,934,476 |
| Events in quadrant C | 7,218,418 | 1,936,411 |
| Events in quadrant D | 16,313,100 | 1,756,986 |
| Mode M9 | |||
|---|---|---|---|
| Quadrant | BADHDUFLAG | Total packets | Discarded packets |
| A | 0 | 21 | 0 |
| B | 0 | 21 | 0 |
| C | 0 | 21 | 0 |
| D | 0 | 21 | 0 |
| Mode SS | |||
|---|---|---|---|
| Quadrant | BADHDUFLAG | Total packets | Discarded packets |
| A | 0 | 556 | 0 |
| B | 0 | 556 | 0 |
| C | 0 | 556 | 0 |
| D | 0 | 556 | 0 |
| Mode M0 | |||
|---|---|---|---|
| Quadrant | BADHDUFLAG | Total packets | Discarded packets |
| A | 0 | 56203 | 0 |
| B | 0 | 67010 | 0 |
| C | 0 | 61797 | 0 |
| D | 0 | 89952 | 0 |
| Quadrant | Total seconds | Saturated seconds | Saturation percentage |
|---|---|---|---|
| A | 27130 | 358 | 1.319572% |
| B | 27130 | 1031 | 3.800221% |
| C | 27130 | 601 | 2.215260% |
| D | 27130 | 3291 | 12.130483% |
Noise dominated data is calculated using 1-second bins in cleaned event files. If a bin has >2000 counts, and if more than 50% of those come from <1% of pixels, then it is considered to be noise-dominated and hence unusable.
| Quadrant | # 1 sec bins | Bins with >0 counts | Bins with >2000 counts | High rate bins dominated by noise | Noise dominated (total time) | Noise dominated (detector-on time) | Marked lightcurve |
|---|---|---|---|---|---|---|---|
| A | 29462 | 27133 | 2 | 2 | 0.01% | 0.01% |  |
| B | 29462 | 27134 | 86 | 86 | 0.29% | 0.32% |  |
| C | 29462 | 27132 | 65 | 65 | 0.22% | 0.24% |  |
| D | 29462 | 27133 | 1635 | 1635 | 5.55% | 6.03% |  |
Top three noisy pixels from each quadrant. If the there are fewer than three noisy pixels in the level2.evt file, extra rows are filled as -1
| Pixel properties | Quadrant properties | ||||||
|---|---|---|---|---|---|---|---|
| Quadrant | DetID | PixID | Counts | Sigma | Mean | Median | Sigma |
| A | 12 | 189 | 102021 | 328.57 | 1373 | 1341 | 306.4 |
| A | 15 | 69 | 21837 | 66.89 | 1373 | 1341 | 306.4 |
| A | 4 | 2 | 16264 | 48.7 | 1373 | 1341 | 306.4 |
| B | 10 | 16 | 2351835 | 8976.95 | 1342 | 1301 | 261.8 |
| B | 0 | 189 | 260544 | 990.08 | 1342 | 1301 | 261.8 |
| B | 0 | 219 | 202972 | 770.2 | 1342 | 1301 | 261.8 |
| C | 9 | 236 | 1437293 | 4776.38 | 1325 | 1301 | 300.6 |
| C | 3 | 233 | 549777 | 1824.33 | 1325 | 1301 | 300.6 |
| C | 10 | 22 | 28770 | 91.37 | 1325 | 1301 | 300.6 |
| D | 7 | 254 | 10733026 | 35280.56 | 1286 | 1245 | 304.2 |
| D | 10 | 70 | 217832 | 712.03 | 1286 | 1245 | 304.2 |
| D | 13 | 249 | 142918 | 465.75 | 1286 | 1245 | 304.2 |
Histogram calculated using DETX and DETY for each event in the final _common_clean file
| Quadrant A | 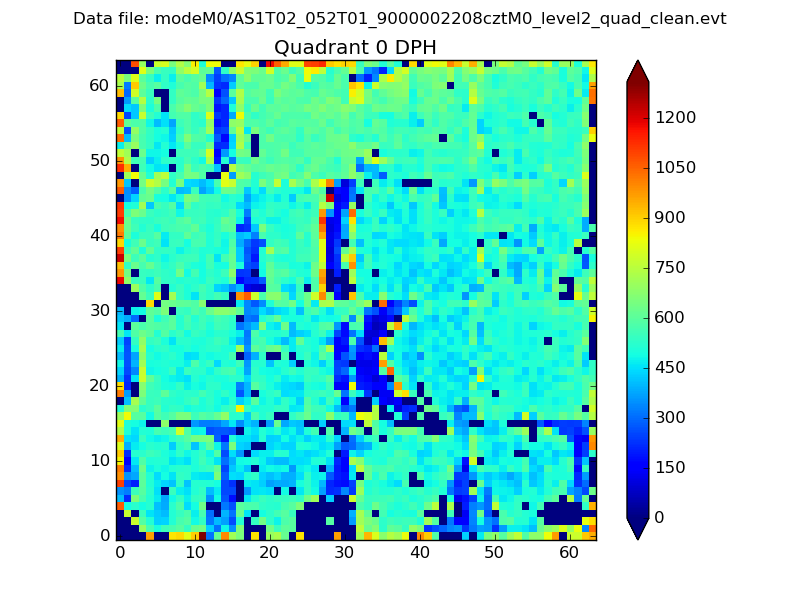 |
 |
Quadrant B |
|---|---|---|---|
| Quadrant D |  |
 |
Quadrant C |
| Plot type | Count rate plots | Images |
|---|---|---|
| Comparison with Poisson distribution Blue bars denote a histogram of data divided into 1 sec bins. Red curve is a Poisson curve with rate = median count rate of data. |
 |
 |
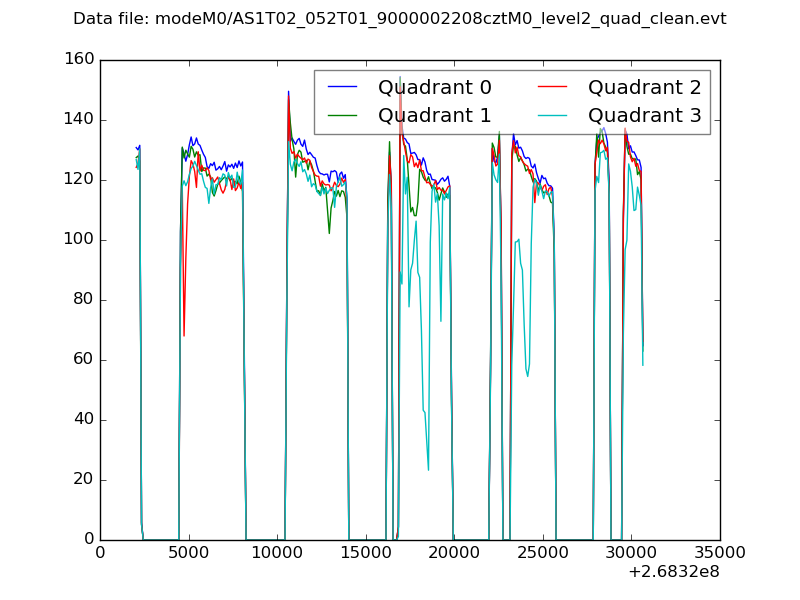
| Quadrant-wise count rates Data is divided into 100 sec bins |
 |
|
| Module-wise count rates for Quadrant A Data is divided into 100 sec bins |
 |
 |
| Module-wise count rates for Quadrant B Data is divided into 100 sec bins |
 |
 |
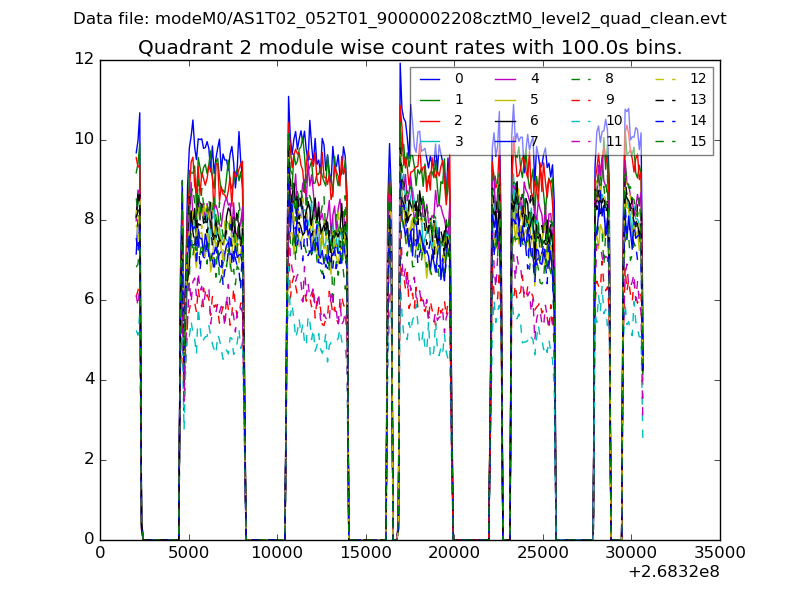
| Module-wise count rates for Quadrant C Data is divided into 100 sec bins |
 |
 |
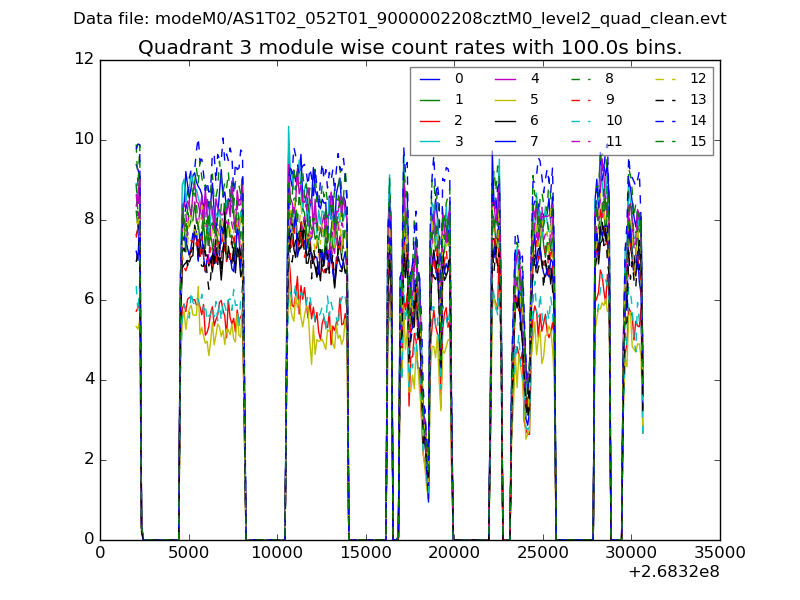
| Module-wise count rates for Quadrant D Data is divided into 100 sec bins |
 |
 |
| Parameter | Plot |
|---|---|
| CZT HV Monitor | 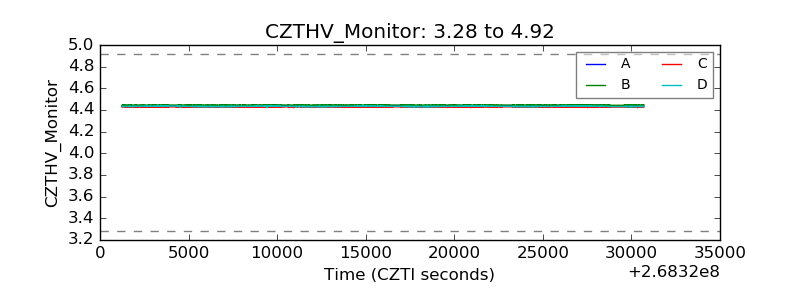 |
| D_VDD |  |
| Temperature 1 |  |
| Veto HV Monitor |  |
| Veto LLD |  |
| Alpha Counter | 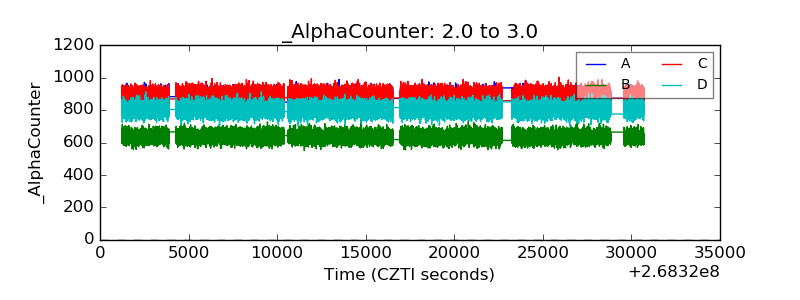 |
| _CPM_Rate |  |
| CZT Counter |  |
| +2.5 Volts monitor |  |
| +5 Volts monitor |  |
| _ROLL_ROT | 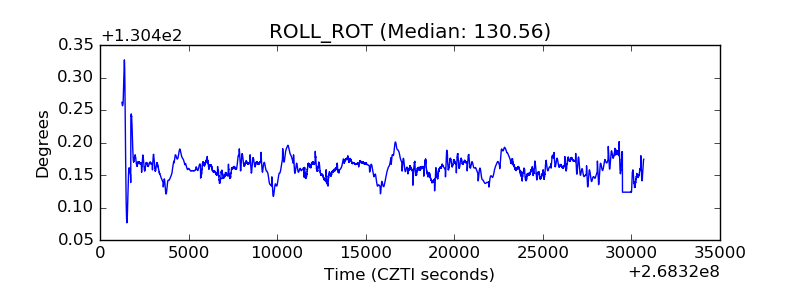 |
| _Roll_DEC |  |
| _Roll_RA |  |
| Veto Counter |  |