| Param | Original file | Final file |
|---|---|---|
| Filename | modeM0/AS1T02_055T01_9000002206cztM0_level2_bc.evt | modeM0/AS1T02_055T01_9000002206cztM0_level2_quad_clean.evt |
| Size (bytes) | 2,683,523,520 | 1,019,808,000 |
| Size | 2.5 GB | 972.6 MB |
| Events in quadrant A | 15,317,215 | 6,720,283 |
| Events in quadrant B | 27,762,243 | 6,488,077 |
| Events in quadrant C | 15,160,147 | 6,494,267 |
| Events in quadrant D | 18,253,901 | 6,379,341 |
| Mode M9 | |||
|---|---|---|---|
| Quadrant | BADHDUFLAG | Total packets | Discarded packets |
| A | 0 | 116 | 0 |
| B | 0 | 116 | 0 |
| C | 0 | 116 | 0 |
| D | 0 | 116 | 0 |
| Mode M0 | |||
|---|---|---|---|
| Quadrant | BADHDUFLAG | Total packets | Discarded packets |
| A | 0 | 145429 | 0 |
| B | 0 | 196748 | 0 |
| C | 0 | 143643 | 0 |
| D | 0 | 157671 | 0 |
| Mode SS | |||
|---|---|---|---|
| Quadrant | BADHDUFLAG | Total packets | Discarded packets |
| A | 0 | 1430 | 0 |
| B | 0 | 1430 | 0 |
| C | 0 | 1430 | 0 |
| D | 0 | 1430 | 0 |
| Quadrant | Total seconds | Saturated seconds | Saturation percentage |
|---|---|---|---|
| A | 70114 | 633 | 0.902815% |
| B | 70114 | 4943 | 7.049947% |
| C | 70114 | 492 | 0.701714% |
| D | 70114 | 1507 | 2.149357% |
Noise dominated data is calculated using 1-second bins in cleaned event files. If a bin has >2000 counts, and if more than 50% of those come from <1% of pixels, then it is considered to be noise-dominated and hence unusable.
| Quadrant | # 1 sec bins | Bins with >0 counts | Bins with >2000 counts | High rate bins dominated by noise | Noise dominated (total time) | Noise dominated (detector-on time) | Marked lightcurve |
|---|---|---|---|---|---|---|---|
| A | 81710 | 70117 | 0 | 0 | 0.00% | 0.00% |  |
| B | 81710 | 70115 | 559 | 559 | 0.68% | 0.80% |  |
| C | 81710 | 70116 | 2 | 2 | 0.00% | 0.00% |  |
| D | 81710 | 70114 | 152 | 152 | 0.19% | 0.22% |  |
Top three noisy pixels from each quadrant. If the there are fewer than three noisy pixels in the level2.evt file, extra rows are filled as -1
| Pixel properties | Quadrant properties | ||||||
|---|---|---|---|---|---|---|---|
| Quadrant | DetID | PixID | Counts | Sigma | Mean | Median | Sigma |
| A | 12 | 189 | 816229 | 1008.56 | 3676 | 3606 | 805.7 |
| A | 3 | 1 | 165343 | 200.73 | 3676 | 3606 | 805.7 |
| A | 4 | 2 | 71779 | 84.61 | 3676 | 3606 | 805.7 |
| B | 10 | 16 | 11041782 | 16088.6 | 3566 | 3469 | 686.1 |
| B | 0 | 219 | 1307153 | 1900.15 | 3566 | 3469 | 686.1 |
| B | 0 | 229 | 742417 | 1077.03 | 3566 | 3469 | 686.1 |
| C | 3 | 233 | 1342132 | 1751.18 | 3504 | 3466 | 764.4 |
| C | 9 | 236 | 42370 | 50.89 | 3504 | 3466 | 764.4 |
| C | 10 | 22 | 32454 | 37.92 | 3504 | 3466 | 764.4 |
| D | 7 | 254 | 2002274 | 2431.88 | 3540 | 3437 | 821.9 |
| D | 13 | 249 | 637103 | 770.95 | 3540 | 3437 | 821.9 |
| D | 2 | 33 | 586067 | 708.86 | 3540 | 3437 | 821.9 |
Histogram calculated using DETX and DETY for each event in the final _common_clean file
| Quadrant A | 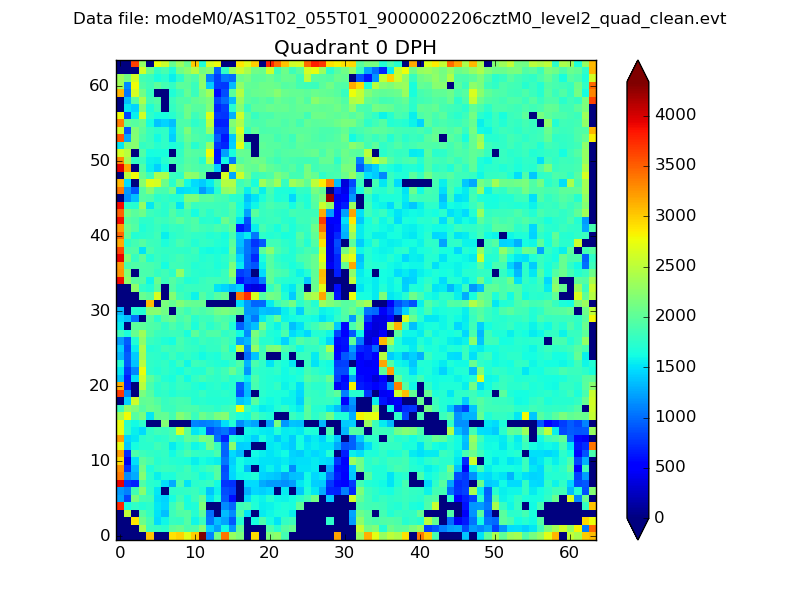 |
 |
Quadrant B |
|---|---|---|---|
| Quadrant D |  |
 |
Quadrant C |
| Plot type | Count rate plots | Images |
|---|---|---|
| Comparison with Poisson distribution Blue bars denote a histogram of data divided into 1 sec bins. Red curve is a Poisson curve with rate = median count rate of data. |
 |
 |
| Quadrant-wise count rates Data is divided into 100 sec bins |
 |
|
| Module-wise count rates for Quadrant A Data is divided into 100 sec bins |
 |
 |
| Module-wise count rates for Quadrant B Data is divided into 100 sec bins |
 |
 |
| Module-wise count rates for Quadrant C Data is divided into 100 sec bins |
 |
 |
| Module-wise count rates for Quadrant D Data is divided into 100 sec bins |
 |
 |
| Parameter | Plot |
|---|---|
| CZT HV Monitor | 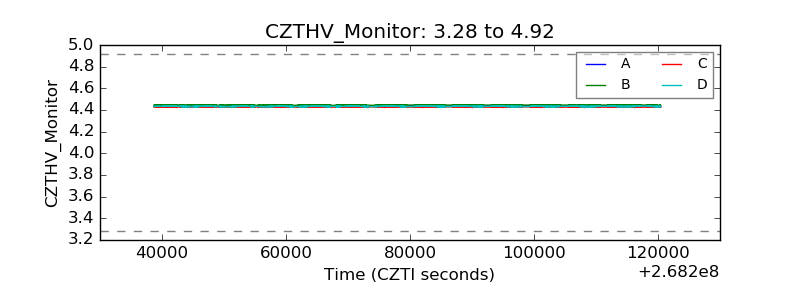 |
| D_VDD |  |
| Temperature 1 |  |
| Veto HV Monitor |  |
| Veto LLD |  |
| Alpha Counter |  |
| _CPM_Rate | 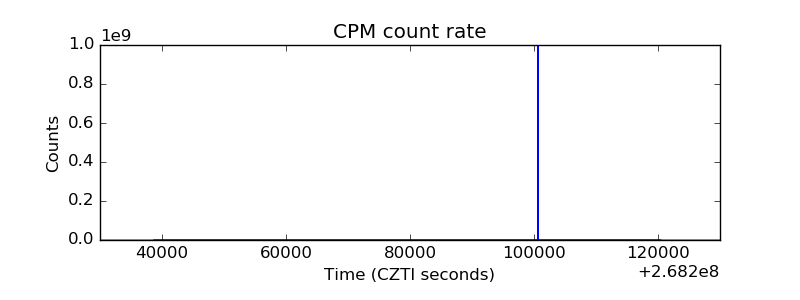 |
| CZT Counter | 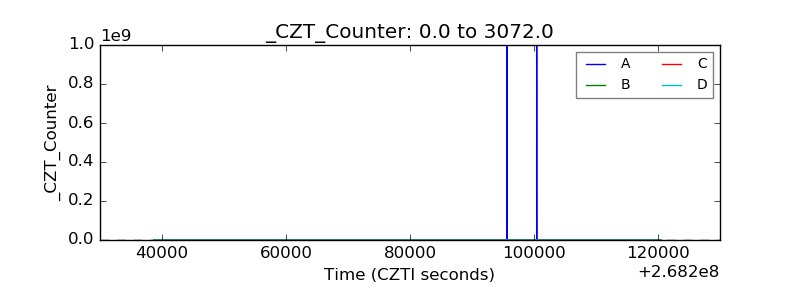 |
| +2.5 Volts monitor |  |
| +5 Volts monitor |  |
| _ROLL_ROT |  |
| _Roll_DEC |  |
| _Roll_RA |  |
| Veto Counter |  |