| Param | Original file | Final file |
|---|---|---|
| Filename | modeM0/AS1T02_054T01_9000002200cztM0_level2_bc.evt | modeM0/AS1T02_054T01_9000002200cztM0_level2_quad_clean.evt |
| Size (bytes) | 3,775,392,000 | 1,448,193,600 |
| Size | 3.5 GB | 1.3 GB |
| Events in quadrant A | 19,930,751 | 9,665,694 |
| Events in quadrant B | 29,468,672 | 9,359,200 |
| Events in quadrant C | 20,551,129 | 9,644,474 |
| Events in quadrant D | 38,329,646 | 9,097,550 |
| Mode M0 | |||
|---|---|---|---|
| Quadrant | BADHDUFLAG | Total packets | Discarded packets |
| A | 0 | 186154 | 0 |
| B | 0 | 224647 | 0 |
| C | 0 | 185505 | 0 |
| D | 0 | 259071 | 0 |
| Mode SS | |||
|---|---|---|---|
| Quadrant | BADHDUFLAG | Total packets | Discarded packets |
| A | 0 | 1810 | 0 |
| B | 0 | 1810 | 0 |
| C | 0 | 1810 | 0 |
| D | 0 | 1810 | 0 |
| Mode M9 | |||
|---|---|---|---|
| Quadrant | BADHDUFLAG | Total packets | Discarded packets |
| A | 0 | 154 | 0 |
| B | 0 | 154 | 0 |
| C | 0 | 154 | 0 |
| D | 0 | 154 | 0 |
| Quadrant | Total seconds | Saturated seconds | Saturation percentage |
|---|---|---|---|
| A | 88972 | 912 | 1.025042% |
| B | 88972 | 5103 | 5.735512% |
| C | 88972 | 641 | 0.720451% |
| D | 88972 | 8139 | 9.147822% |
Noise dominated data is calculated using 1-second bins in cleaned event files. If a bin has >2000 counts, and if more than 50% of those come from <1% of pixels, then it is considered to be noise-dominated and hence unusable.
| Quadrant | # 1 sec bins | Bins with >0 counts | Bins with >2000 counts | High rate bins dominated by noise | Noise dominated (total time) | Noise dominated (detector-on time) | Marked lightcurve |
|---|---|---|---|---|---|---|---|
| A | 103897 | 88975 | 13 | 13 | 0.01% | 0.01% |  |
| B | 103897 | 88963 | 858 | 858 | 0.83% | 0.96% |  |
| C | 103898 | 88976 | 3 | 3 | 0.00% | 0.00% |  |
| D | 103898 | 88957 | 1844 | 1844 | 1.77% | 2.07% |  |
Top three noisy pixels from each quadrant. If the there are fewer than three noisy pixels in the level2.evt file, extra rows are filled as -1
| Pixel properties | Quadrant properties | ||||||
|---|---|---|---|---|---|---|---|
| Quadrant | DetID | PixID | Counts | Sigma | Mean | Median | Sigma |
| A | 12 | 189 | 619433 | 595.11 | 4773 | 4698 | 1033.0 |
| A | 15 | 239 | 283199 | 269.61 | 4773 | 4698 | 1033.0 |
| A | 11 | 29 | 192547 | 181.85 | 4773 | 4698 | 1033.0 |
| B | 3 | 64 | 5465494 | 6409.97 | 4622 | 4526 | 851.9 |
| B | 10 | 16 | 3434254 | 4025.74 | 4622 | 4526 | 851.9 |
| B | 0 | 189 | 840995 | 981.83 | 4622 | 4526 | 851.9 |
| C | 3 | 233 | 1879163 | 1820.03 | 4675 | 4631 | 1029.9 |
| C | 0 | 207 | 310158 | 296.64 | 4675 | 4631 | 1029.9 |
| C | 3 | 232 | 32087 | 26.66 | 4675 | 4631 | 1029.9 |
| D | 7 | 254 | 18755924 | 17801.76 | 4536 | 4423 | 1053.4 |
| D | 13 | 104 | 1000605 | 945.73 | 4536 | 4423 | 1053.4 |
| D | 2 | 234 | 328053 | 307.24 | 4536 | 4423 | 1053.4 |
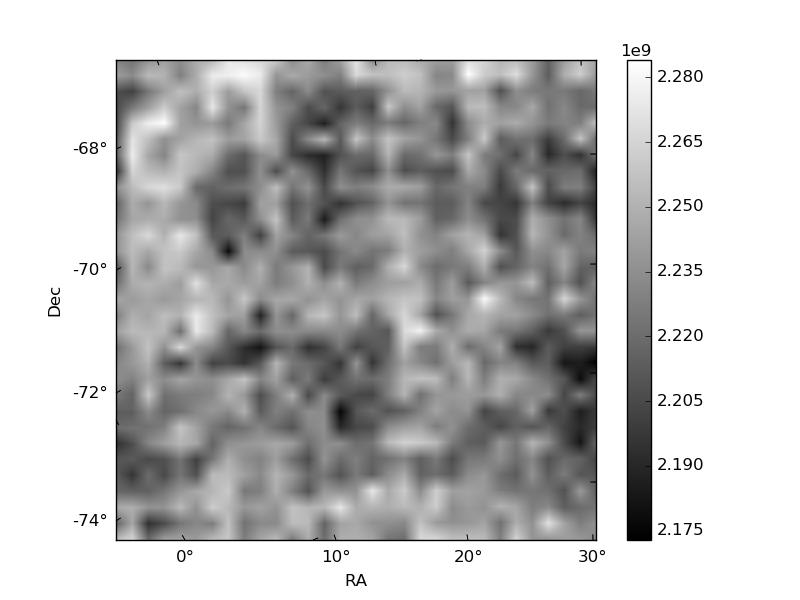
Histogram calculated using DETX and DETY for each event in the final _common_clean file
| Quadrant A |  |
 |
Quadrant B |
|---|---|---|---|
| Quadrant D |  |
 |
Quadrant C |
| Plot type | Count rate plots | Images |
|---|---|---|
| Comparison with Poisson distribution Blue bars denote a histogram of data divided into 1 sec bins. Red curve is a Poisson curve with rate = median count rate of data. |
 |
 |
| Quadrant-wise count rates Data is divided into 100 sec bins |
 |
|
| Module-wise count rates for Quadrant A Data is divided into 100 sec bins |
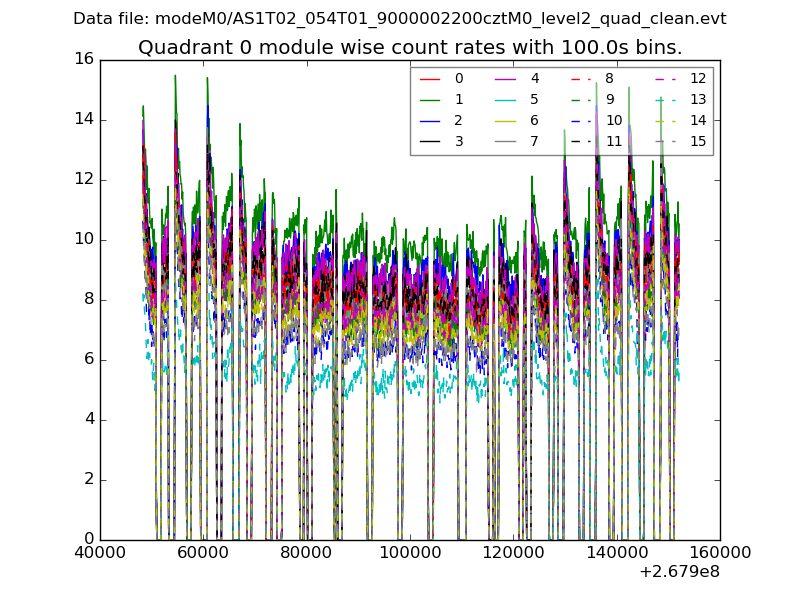 |
 |
| Module-wise count rates for Quadrant B Data is divided into 100 sec bins |
 |
 |
| Module-wise count rates for Quadrant C Data is divided into 100 sec bins |
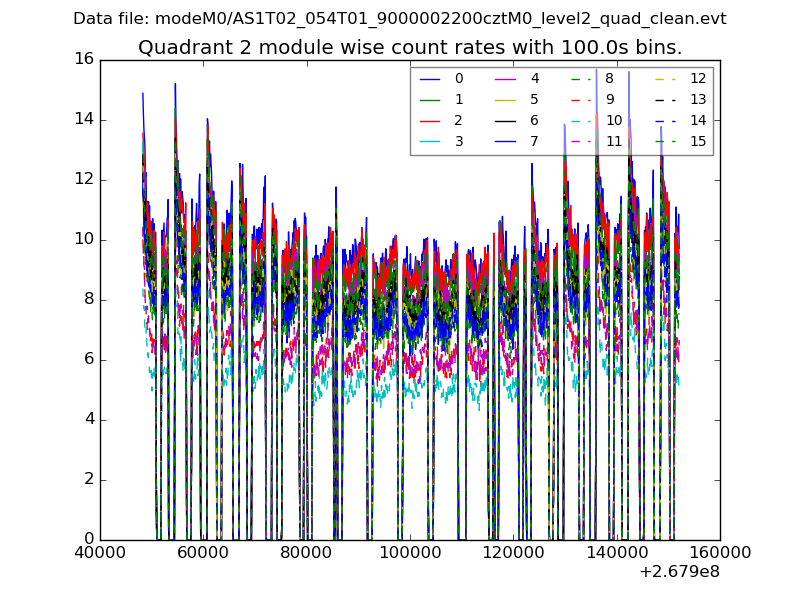 |
 |
| Module-wise count rates for Quadrant D Data is divided into 100 sec bins |
 |
 |
| Parameter | Plot |
|---|---|
| CZT HV Monitor | 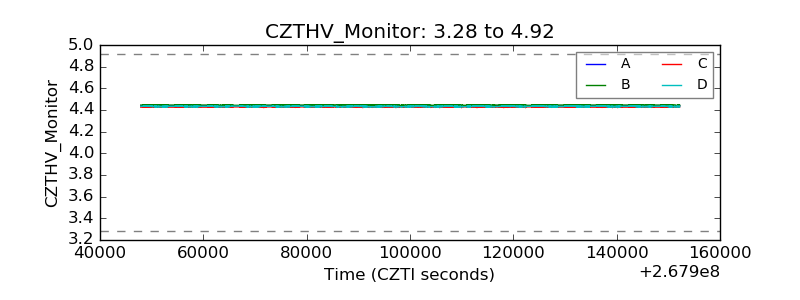 |
| D_VDD |  |
| Temperature 1 |  |
| Veto HV Monitor | 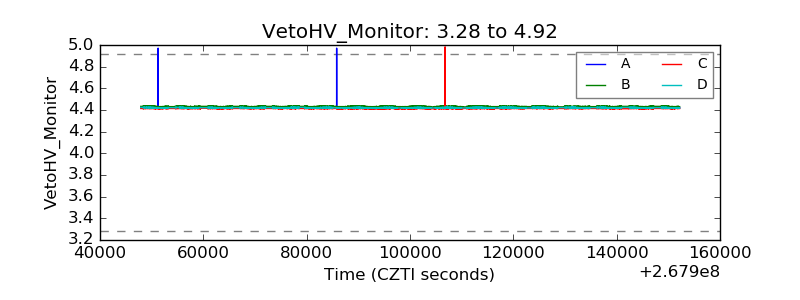 |
| Veto LLD |  |
| Alpha Counter |  |
| _CPM_Rate |  |
| CZT Counter |  |
| +2.5 Volts monitor |  |
| +5 Volts monitor |  |
| _ROLL_ROT | 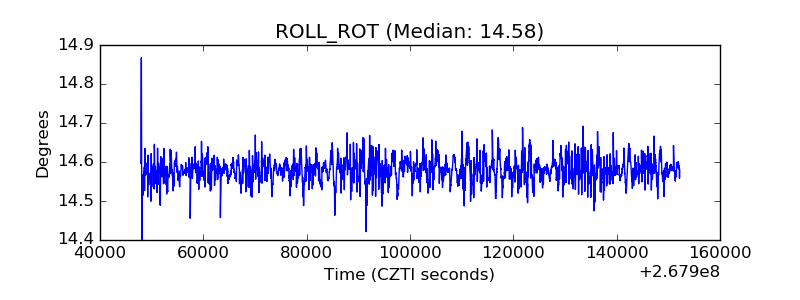 |
| _Roll_DEC |  |
| _Roll_RA |  |
| Veto Counter | 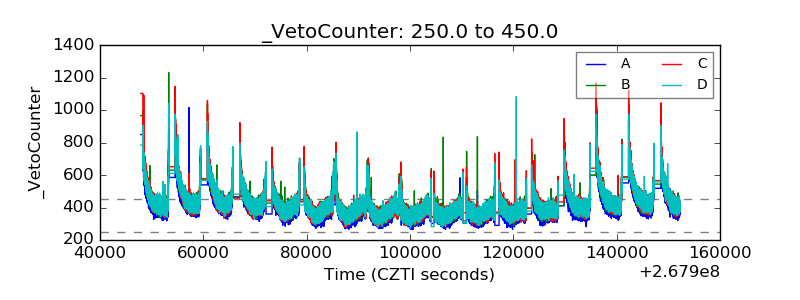 |