| Param | Original file | Final file |
|---|---|---|
| Filename | modeM0/AS1G08_044T01_9000002196cztM0_level2_bc.evt | modeM0/AS1G08_044T01_9000002196cztM0_level2_quad_clean.evt |
| Size (bytes) | 620,585,280 | 218,278,080 |
| Size | 591.8 MB | 208.2 MB |
| Events in quadrant A | 3,663,794 | 1,405,499 |
| Events in quadrant B | 3,770,753 | 1,402,662 |
| Events in quadrant C | 3,694,194 | 1,342,102 |
| Events in quadrant D | 6,531,895 | 1,320,110 |
| Mode M9 | |||
|---|---|---|---|
| Quadrant | BADHDUFLAG | Total packets | Discarded packets |
| A | 0 | 11 | 0 |
| B | 0 | 11 | 0 |
| C | 0 | 11 | 0 |
| D | 0 | 11 | 0 |
| Mode M0 | |||
|---|---|---|---|
| Quadrant | BADHDUFLAG | Total packets | Discarded packets |
| A | 0 | 34998 | 0 |
| B | 0 | 35336 | 0 |
| C | 0 | 34448 | 0 |
| D | 0 | 44785 | 0 |
| Mode SS | |||
|---|---|---|---|
| Quadrant | BADHDUFLAG | Total packets | Discarded packets |
| A | 0 | 338 | 0 |
| B | 0 | 338 | 0 |
| C | 0 | 338 | 0 |
| D | 0 | 338 | 0 |
| Quadrant | Total seconds | Saturated seconds | Saturation percentage |
|---|---|---|---|
| A | 16535 | 212 | 1.282129% |
| B | 16535 | 281 | 1.699425% |
| C | 16535 | 167 | 1.009979% |
| D | 16535 | 931 | 5.630481% |
Noise dominated data is calculated using 1-second bins in cleaned event files. If a bin has >2000 counts, and if more than 50% of those come from <1% of pixels, then it is considered to be noise-dominated and hence unusable.
| Quadrant | # 1 sec bins | Bins with >0 counts | Bins with >2000 counts | High rate bins dominated by noise | Noise dominated (total time) | Noise dominated (detector-on time) | Marked lightcurve |
|---|---|---|---|---|---|---|---|
| A | 17771 | 16538 | 22 | 22 | 0.12% | 0.13% |  |
| B | 17771 | 16536 | 11 | 11 | 0.06% | 0.07% |  |
| C | 17771 | 16536 | 0 | 0 | 0.00% | 0.00% |  |
| D | 17771 | 16535 | 280 | 280 | 1.58% | 1.69% |  |
Top three noisy pixels from each quadrant. If the there are fewer than three noisy pixels in the level2.evt file, extra rows are filled as -1
| Pixel properties | Quadrant properties | ||||||
|---|---|---|---|---|---|---|---|
| Quadrant | DetID | PixID | Counts | Sigma | Mean | Median | Sigma |
| A | 12 | 189 | 200519 | 1037.83 | 851 | 830 | 192.4 |
| A | 15 | 239 | 180515 | 933.86 | 851 | 830 | 192.4 |
| A | 3 | 1 | 7617 | 35.27 | 851 | 830 | 192.4 |
| B | 0 | 219 | 214925 | 1264.49 | 849 | 824 | 169.3 |
| B | 5 | 96 | 57050 | 332.07 | 849 | 824 | 169.3 |
| B | 0 | 189 | 54477 | 316.88 | 849 | 824 | 169.3 |
| C | 3 | 233 | 460914 | 2526.19 | 816 | 804 | 182.1 |
| C | 9 | 54 | 18273 | 95.91 | 816 | 804 | 182.1 |
| C | 3 | 232 | 11064 | 56.33 | 816 | 804 | 182.1 |
| D | 13 | 104 | 2664190 | 14210.26 | 804 | 781 | 187.4 |
| D | 7 | 254 | 734794 | 3916.23 | 804 | 781 | 187.4 |
| D | 2 | 234 | 58792 | 309.51 | 804 | 781 | 187.4 |
Histogram calculated using DETX and DETY for each event in the final _common_clean file
| Quadrant A |  |
 |
Quadrant B |
|---|---|---|---|
| Quadrant D |  |
 |
Quadrant C |
| Plot type | Count rate plots | Images |
|---|---|---|
| Comparison with Poisson distribution Blue bars denote a histogram of data divided into 1 sec bins. Red curve is a Poisson curve with rate = median count rate of data. |
 |
 |
| Quadrant-wise count rates Data is divided into 100 sec bins |
 |
|
| Module-wise count rates for Quadrant A Data is divided into 100 sec bins |
 |
 |
| Module-wise count rates for Quadrant B Data is divided into 100 sec bins |
 |
 |
| Module-wise count rates for Quadrant C Data is divided into 100 sec bins |
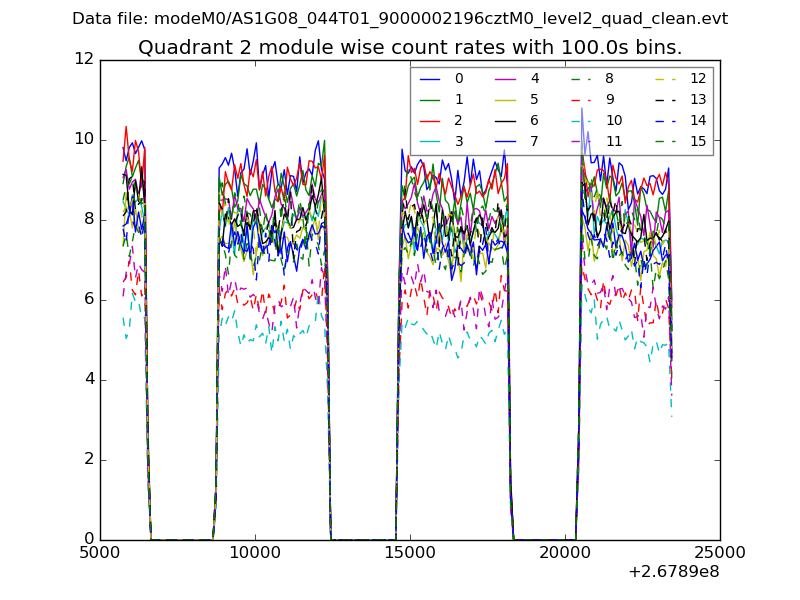 |
 |
| Module-wise count rates for Quadrant D Data is divided into 100 sec bins |
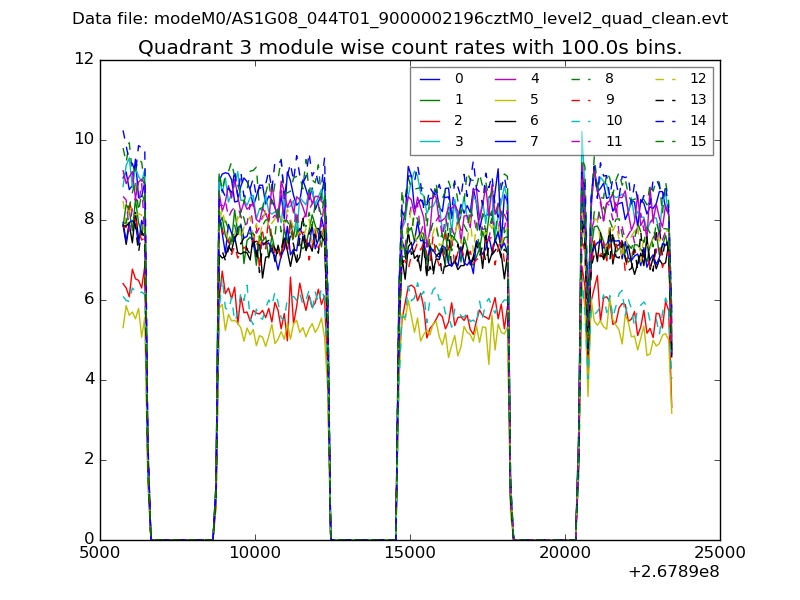 |
 |
| Parameter | Plot |
|---|---|
| CZT HV Monitor |  |
| D_VDD |  |
| Temperature 1 |  |
| Veto HV Monitor |  |
| Veto LLD |  |
| Alpha Counter |  |
| _CPM_Rate |  |
| CZT Counter |  |
| +2.5 Volts monitor |  |
| +5 Volts monitor |  |
| _ROLL_ROT |  |
| _Roll_DEC |  |
| _Roll_RA |  |
| Veto Counter |  |