| Param | Original file | Final file |
|---|---|---|
| Filename | modeM0/AS1A04_148T02_9000002198cztM0_level2_bc.evt | modeM0/AS1A04_148T02_9000002198cztM0_level2_quad_clean.evt |
| Size (bytes) | 1,021,273,920 | 378,288,000 |
| Size | 974.0 MB | 360.8 MB |
| Events in quadrant A | 6,079,681 | 2,418,537 |
| Events in quadrant B | 6,712,720 | 2,406,616 |
| Events in quadrant C | 6,103,691 | 2,355,468 |
| Events in quadrant D | 10,078,569 | 2,310,120 |
| Mode M9 | |||
|---|---|---|---|
| Quadrant | BADHDUFLAG | Total packets | Discarded packets |
| A | 0 | 39 | 0 |
| B | 0 | 39 | 0 |
| C | 0 | 39 | 0 |
| D | 0 | 39 | 0 |
| Mode M0 | |||
|---|---|---|---|
| Quadrant | BADHDUFLAG | Total packets | Discarded packets |
| A | 0 | 59239 | 0 |
| B | 0 | 62358 | 0 |
| C | 0 | 58676 | 0 |
| D | 0 | 72178 | 0 |
| Mode SS | |||
|---|---|---|---|
| Quadrant | BADHDUFLAG | Total packets | Discarded packets |
| A | 0 | 582 | 0 |
| B | 0 | 582 | 0 |
| C | 0 | 582 | 0 |
| D | 0 | 582 | 0 |
| Quadrant | Total seconds | Saturated seconds | Saturation percentage |
|---|---|---|---|
| A | 28627 | 118 | 0.412198% |
| B | 28627 | 263 | 0.918713% |
| C | 28627 | 83 | 0.289936% |
| D | 28627 | 574 | 2.005100% |
Noise dominated data is calculated using 1-second bins in cleaned event files. If a bin has >2000 counts, and if more than 50% of those come from <1% of pixels, then it is considered to be noise-dominated and hence unusable.
| Quadrant | # 1 sec bins | Bins with >0 counts | Bins with >2000 counts | High rate bins dominated by noise | Noise dominated (total time) | Noise dominated (detector-on time) | Marked lightcurve |
|---|---|---|---|---|---|---|---|
| A | 32383 | 28630 | 3 | 3 | 0.01% | 0.01% |  |
| B | 32383 | 28629 | 11 | 11 | 0.03% | 0.04% |  |
| C | 32383 | 28629 | 0 | 0 | 0.00% | 0.00% |  |
| D | 32383 | 28629 | 341 | 341 | 1.05% | 1.19% |  |
Top three noisy pixels from each quadrant. If the there are fewer than three noisy pixels in the level2.evt file, extra rows are filled as -1
| Pixel properties | Quadrant properties | ||||||
|---|---|---|---|---|---|---|---|
| Quadrant | DetID | PixID | Counts | Sigma | Mean | Median | Sigma |
| A | 12 | 189 | 434689 | 1358.63 | 1441 | 1415 | 318.9 |
| A | 9 | 143 | 47461 | 144.39 | 1441 | 1415 | 318.9 |
| A | 15 | 239 | 28244 | 84.13 | 1441 | 1415 | 318.9 |
| B | 0 | 219 | 347733 | 1251.65 | 1433 | 1395 | 276.7 |
| B | 0 | 189 | 227437 | 816.9 | 1433 | 1395 | 276.7 |
| B | 3 | 64 | 126094 | 450.66 | 1433 | 1395 | 276.7 |
| C | 3 | 233 | 628651 | 2038.13 | 1385 | 1366 | 307.8 |
| C | 0 | 207 | 15621 | 46.32 | 1385 | 1366 | 307.8 |
| C | 3 | 232 | 13826 | 40.48 | 1385 | 1366 | 307.8 |
| D | 13 | 104 | 3430262 | 10231.69 | 1401 | 1358 | 335.1 |
| D | 7 | 254 | 719395 | 2142.59 | 1401 | 1358 | 335.1 |
| D | 10 | 70 | 196014 | 580.84 | 1401 | 1358 | 335.1 |
Histogram calculated using DETX and DETY for each event in the final _common_clean file
| Quadrant A |  |
 |
Quadrant B |
|---|---|---|---|
| Quadrant D |  |
 |
Quadrant C |
| Plot type | Count rate plots | Images |
|---|---|---|
| Comparison with Poisson distribution Blue bars denote a histogram of data divided into 1 sec bins. Red curve is a Poisson curve with rate = median count rate of data. |
 |
 |
| Quadrant-wise count rates Data is divided into 100 sec bins |
 |
|
| Module-wise count rates for Quadrant A Data is divided into 100 sec bins |
 |
 |
| Module-wise count rates for Quadrant B Data is divided into 100 sec bins |
 |
 |
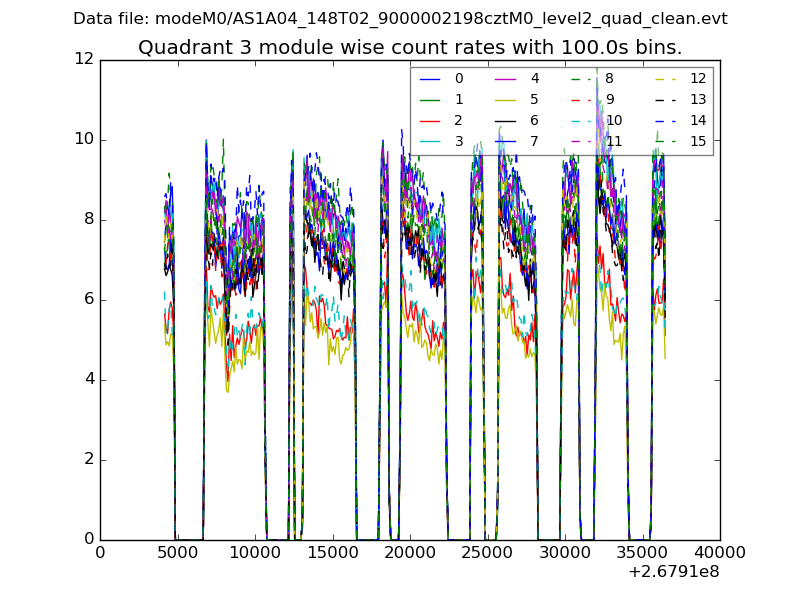
| Module-wise count rates for Quadrant C Data is divided into 100 sec bins |
 |
 |
| Module-wise count rates for Quadrant D Data is divided into 100 sec bins |
 |
 |
| Parameter | Plot |
|---|---|
| CZT HV Monitor |  |
| D_VDD | 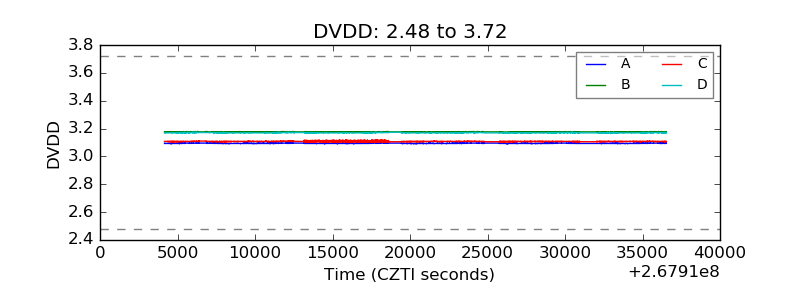 |
| Temperature 1 |  |
| Veto HV Monitor |  |
| Veto LLD |  |
| Alpha Counter |  |
| _CPM_Rate |  |
| CZT Counter |  |
| +2.5 Volts monitor |  |
| +5 Volts monitor |  |
| _ROLL_ROT |  |
| _Roll_DEC |  |
| _Roll_RA |  |
| Veto Counter |  |