| Param | Original file | Final file |
|---|---|---|
| Filename | modeM0/AS1A04_218T01_9000002194cztM0_level2_bc.evt | modeM0/AS1A04_218T01_9000002194cztM0_level2_quad_clean.evt |
| Size (bytes) | 4,066,367,040 | 1,403,496,000 |
| Size | 3.8 GB | 1.3 GB |
| Events in quadrant A | 22,582,616 | 9,232,166 |
| Events in quadrant B | 26,058,765 | 9,068,561 |
| Events in quadrant C | 24,528,999 | 8,955,025 |
| Events in quadrant D | 43,303,623 | 8,533,283 |
| Mode SS | |||
|---|---|---|---|
| Quadrant | BADHDUFLAG | Total packets | Discarded packets |
| A | 0 | 1996 | 0 |
| B | 0 | 1996 | 0 |
| C | 0 | 1996 | 0 |
| D | 0 | 1996 | 0 |
| Mode M0 | |||
|---|---|---|---|
| Quadrant | BADHDUFLAG | Total packets | Discarded packets |
| A | 0 | 208366 | 0 |
| B | 0 | 223418 | 0 |
| C | 0 | 211854 | 0 |
| D | 0 | 279286 | 0 |
| Mode M9 | |||
|---|---|---|---|
| Quadrant | BADHDUFLAG | Total packets | Discarded packets |
| A | 0 | 176 | 0 |
| B | 0 | 176 | 0 |
| C | 0 | 176 | 0 |
| D | 0 | 177 | 0 |
| Quadrant | Total seconds | Saturated seconds | Saturation percentage |
|---|---|---|---|
| A | 98089 | 1253 | 1.277411% |
| B | 98087 | 1920 | 1.957446% |
| C | 98091 | 906 | 0.923632% |
| D | 98096 | 8297 | 8.458041% |
Noise dominated data is calculated using 1-second bins in cleaned event files. If a bin has >2000 counts, and if more than 50% of those come from <1% of pixels, then it is considered to be noise-dominated and hence unusable.
| Quadrant | # 1 sec bins | Bins with >0 counts | Bins with >2000 counts | High rate bins dominated by noise | Noise dominated (total time) | Noise dominated (detector-on time) | Marked lightcurve |
|---|---|---|---|---|---|---|---|
| A | 115347 | 98111 | 17 | 17 | 0.01% | 0.02% |  |
| B | 115347 | 98105 | 101 | 101 | 0.09% | 0.10% |  |
| C | 115347 | 98110 | 2 | 2 | 0.00% | 0.00% |  |
| D | 115347 | 98101 | 3278 | 3278 | 2.84% | 3.34% |  |
Top three noisy pixels from each quadrant. If the there are fewer than three noisy pixels in the level2.evt file, extra rows are filled as -1
| Pixel properties | Quadrant properties | ||||||
|---|---|---|---|---|---|---|---|
| Quadrant | DetID | PixID | Counts | Sigma | Mean | Median | Sigma |
| A | 12 | 189 | 999524 | 843.77 | 5449 | 5354 | 1178.2 |
| A | 9 | 143 | 249200 | 206.96 | 5449 | 5354 | 1178.2 |
| A | 15 | 239 | 137872 | 112.47 | 5449 | 5354 | 1178.2 |
| B | 3 | 64 | 1426240 | 1422.27 | 5375 | 5245 | 999.1 |
| B | 0 | 219 | 1015781 | 1011.44 | 5375 | 5245 | 999.1 |
| B | 0 | 189 | 826520 | 822.01 | 5375 | 5245 | 999.1 |
| C | 3 | 233 | 3799601 | 3337.18 | 5220 | 5158 | 1137.0 |
| C | 6 | 96 | 159482 | 135.73 | 5220 | 5158 | 1137.0 |
| C | 7 | 247 | 85992 | 71.09 | 5220 | 5158 | 1137.0 |
| D | 13 | 104 | 16552819 | 13821.61 | 5129 | 4991 | 1197.2 |
| D | 7 | 254 | 3792291 | 3163.35 | 5129 | 4991 | 1197.2 |
| D | 15 | 0 | 1596625 | 1329.42 | 5129 | 4991 | 1197.2 |
Histogram calculated using DETX and DETY for each event in the final _common_clean file
| Quadrant A | 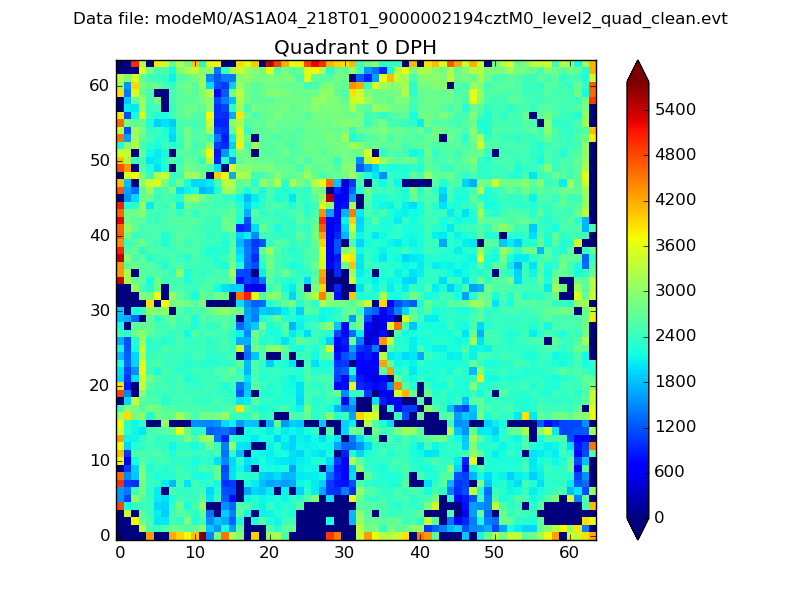 |
 |
Quadrant B |
|---|---|---|---|
| Quadrant D |  |
 |
Quadrant C |
| Plot type | Count rate plots | Images |
|---|---|---|
| Comparison with Poisson distribution Blue bars denote a histogram of data divided into 1 sec bins. Red curve is a Poisson curve with rate = median count rate of data. |
 |
 |
| Quadrant-wise count rates Data is divided into 100 sec bins |
 |
|
| Module-wise count rates for Quadrant A Data is divided into 100 sec bins |
 |
 |
| Module-wise count rates for Quadrant B Data is divided into 100 sec bins |
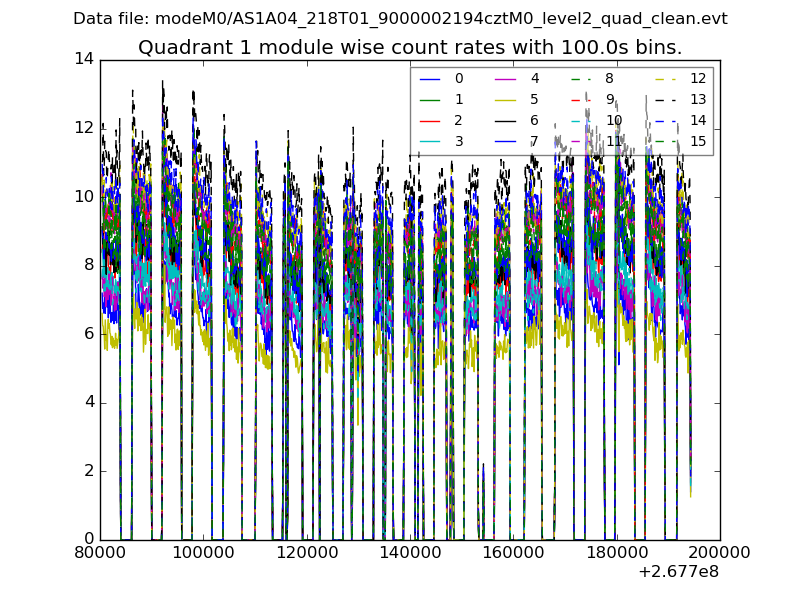 |
 |
| Module-wise count rates for Quadrant C Data is divided into 100 sec bins |
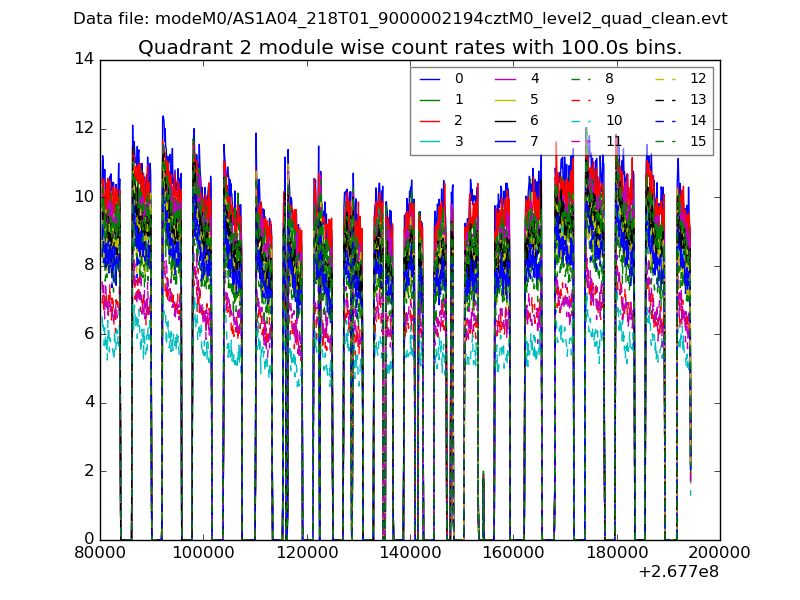 |
 |
| Module-wise count rates for Quadrant D Data is divided into 100 sec bins |
 |
 |
| Parameter | Plot |
|---|---|
| CZT HV Monitor |  |
| D_VDD |  |
| Temperature 1 |  |
| Veto HV Monitor |  |
| Veto LLD |  |
| Alpha Counter |  |
| _CPM_Rate |  |
| CZT Counter |  |
| +2.5 Volts monitor |  |
| +5 Volts monitor | 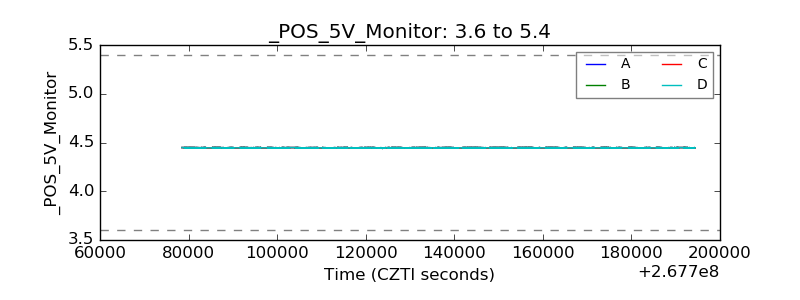 |
| _ROLL_ROT |  |
| _Roll_DEC |  |
| _Roll_RA |  |
| Veto Counter |  |