| Param | Original file | Final file |
|---|---|---|
| Filename | modeM0/AS1C03_005T02_9000002192cztM0_level2_bc.evt | modeM0/AS1C03_005T02_9000002192cztM0_level2_quad_clean.evt |
| Size (bytes) | 2,496,041,280 | 1,121,480,640 |
| Size | 2.3 GB | 1.0 GB |
| Events in quadrant A | 15,430,720 | 7,380,616 |
| Events in quadrant B | 17,497,488 | 7,345,886 |
| Events in quadrant C | 17,879,720 | 7,283,095 |
| Events in quadrant D | 19,973,172 | 7,119,699 |
| Mode SS | |||
|---|---|---|---|
| Quadrant | BADHDUFLAG | Total packets | Discarded packets |
| A | 0 | 1436 | 0 |
| B | 0 | 1436 | 0 |
| C | 0 | 1436 | 0 |
| D | 0 | 1436 | 0 |
| Mode M9 | |||
|---|---|---|---|
| Quadrant | BADHDUFLAG | Total packets | Discarded packets |
| A | 0 | 112 | 0 |
| B | 0 | 112 | 0 |
| C | 0 | 112 | 0 |
| D | 0 | 112 | 0 |
| Mode M0 | |||
|---|---|---|---|
| Quadrant | BADHDUFLAG | Total packets | Discarded packets |
| A | 0 | 147214 | 0 |
| B | 0 | 155434 | 0 |
| C | 0 | 150501 | 0 |
| D | 0 | 161641 | 0 |
| Quadrant | Total seconds | Saturated seconds | Saturation percentage |
|---|---|---|---|
| A | 70630 | 676 | 0.957100% |
| B | 70630 | 1165 | 1.649441% |
| C | 70630 | 581 | 0.822597% |
| D | 70630 | 1089 | 1.541838% |
Noise dominated data is calculated using 1-second bins in cleaned event files. If a bin has >2000 counts, and if more than 50% of those come from <1% of pixels, then it is considered to be noise-dominated and hence unusable.
| Quadrant | # 1 sec bins | Bins with >0 counts | Bins with >2000 counts | High rate bins dominated by noise | Noise dominated (total time) | Noise dominated (detector-on time) | Marked lightcurve |
|---|---|---|---|---|---|---|---|
| A | 81671 | 70632 | 1 | 1 | 0.00% | 0.00% |  |
| B | 81671 | 70630 | 55 | 55 | 0.07% | 0.08% |  |
| C | 81671 | 70632 | 20 | 20 | 0.02% | 0.03% |  |
| D | 81671 | 70632 | 170 | 170 | 0.21% | 0.24% | 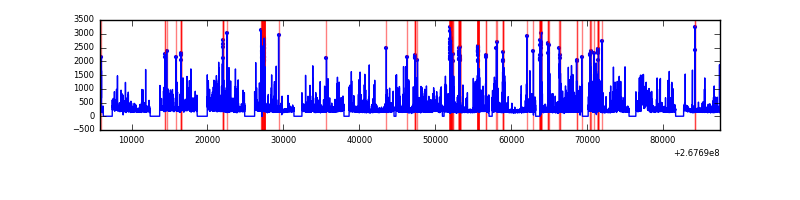 |
Top three noisy pixels from each quadrant. If the there are fewer than three noisy pixels in the level2.evt file, extra rows are filled as -1
| Pixel properties | Quadrant properties | ||||||
|---|---|---|---|---|---|---|---|
| Quadrant | DetID | PixID | Counts | Sigma | Mean | Median | Sigma |
| A | 12 | 189 | 727939 | 894.05 | 3734 | 3670 | 810.1 |
| A | 11 | 29 | 113419 | 135.48 | 3734 | 3670 | 810.1 |
| A | 9 | 143 | 71721 | 84.0 | 3734 | 3670 | 810.1 |
| B | 3 | 64 | 971103 | 1400.29 | 3697 | 3611 | 690.9 |
| B | 0 | 229 | 545560 | 784.39 | 3697 | 3611 | 690.9 |
| B | 0 | 189 | 470770 | 676.14 | 3697 | 3611 | 690.9 |
| C | 3 | 233 | 3092518 | 3834.33 | 3625 | 3589 | 805.6 |
| C | 0 | 207 | 457551 | 563.51 | 3625 | 3589 | 805.6 |
| C | 7 | 247 | 67230 | 79.0 | 3625 | 3589 | 805.6 |
| D | 7 | 254 | 1891226 | 2136.39 | 3663 | 3571 | 883.6 |
| D | 12 | 110 | 1806314 | 2040.29 | 3663 | 3571 | 883.6 |
| D | 13 | 104 | 425741 | 477.8 | 3663 | 3571 | 883.6 |
Histogram calculated using DETX and DETY for each event in the final _common_clean file
| Quadrant A |  |
 |
Quadrant B |
|---|---|---|---|
| Quadrant D |  |
 |
Quadrant C |
| Plot type | Count rate plots | Images |
|---|---|---|
| Comparison with Poisson distribution Blue bars denote a histogram of data divided into 1 sec bins. Red curve is a Poisson curve with rate = median count rate of data. |
 |
 |
| Quadrant-wise count rates Data is divided into 100 sec bins |
 |
|
| Module-wise count rates for Quadrant A Data is divided into 100 sec bins |
 |
 |
| Module-wise count rates for Quadrant B Data is divided into 100 sec bins |
 |
 |
| Module-wise count rates for Quadrant C Data is divided into 100 sec bins |
 |
 |
| Module-wise count rates for Quadrant D Data is divided into 100 sec bins |
 |
 |
| Parameter | Plot |
|---|---|
| CZT HV Monitor |  |
| D_VDD |  |
| Temperature 1 |  |
| Veto HV Monitor |  |
| Veto LLD |  |
| Alpha Counter |  |
| _CPM_Rate |  |
| CZT Counter |  |
| +2.5 Volts monitor |  |
| +5 Volts monitor |  |
| _ROLL_ROT |  |
| _Roll_DEC | 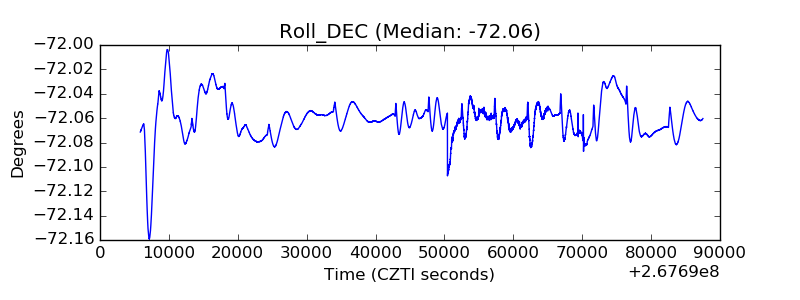 |
| _Roll_RA |  |
| Veto Counter |  |