| Param | Original file | Final file |
|---|---|---|
| Filename | modeM0/AS1G08_010T02_9000002188cztM0_level2_bc.evt | modeM0/AS1G08_010T02_9000002188cztM0_level2_quad_clean.evt |
| Size (bytes) | 2,645,720,640 | 927,008,640 |
| Size | 2.5 GB | 884.1 MB |
| Events in quadrant A | 16,291,087 | 5,987,269 |
| Events in quadrant B | 20,045,416 | 5,887,657 |
| Events in quadrant C | 20,426,880 | 5,742,471 |
| Events in quadrant D | 18,612,559 | 5,681,049 |
| Mode M0 | |||
|---|---|---|---|
| Quadrant | BADHDUFLAG | Total packets | Discarded packets |
| A | 0 | 149898 | 0 |
| B | 0 | 166613 | 0 |
| C | 0 | 165748 | 0 |
| D | 0 | 159706 | 0 |
| Mode M9 | |||
|---|---|---|---|
| Quadrant | BADHDUFLAG | Total packets | Discarded packets |
| A | 0 | 107 | 0 |
| B | 0 | 107 | 0 |
| C | 0 | 107 | 0 |
| D | 0 | 107 | 0 |
| Mode SS | |||
|---|---|---|---|
| Quadrant | BADHDUFLAG | Total packets | Discarded packets |
| A | 0 | 1420 | 0 |
| B | 0 | 1420 | 0 |
| C | 0 | 1420 | 0 |
| D | 0 | 1420 | 0 |
| Quadrant | Total seconds | Saturated seconds | Saturation percentage |
|---|---|---|---|
| A | 69713 | 728 | 1.044282% |
| B | 69713 | 2622 | 3.761135% |
| C | 69713 | 2183 | 3.131410% |
| D | 69713 | 1709 | 2.451480% |
Noise dominated data is calculated using 1-second bins in cleaned event files. If a bin has >2000 counts, and if more than 50% of those come from <1% of pixels, then it is considered to be noise-dominated and hence unusable.
| Quadrant | # 1 sec bins | Bins with >0 counts | Bins with >2000 counts | High rate bins dominated by noise | Noise dominated (total time) | Noise dominated (detector-on time) | Marked lightcurve |
|---|---|---|---|---|---|---|---|
| A | 85658 | 69716 | 3 | 3 | 0.00% | 0.00% |  |
| B | 85658 | 69718 | 221 | 221 | 0.26% | 0.32% |  |
| C | 85658 | 69714 | 33 | 33 | 0.04% | 0.05% |  |
| D | 85658 | 69717 | 145 | 145 | 0.17% | 0.21% |  |
Top three noisy pixels from each quadrant. If the there are fewer than three noisy pixels in the level2.evt file, extra rows are filled as -1
| Pixel properties | Quadrant properties | ||||||
|---|---|---|---|---|---|---|---|
| Quadrant | DetID | PixID | Counts | Sigma | Mean | Median | Sigma |
| A | 12 | 189 | 1658381 | 2043.17 | 3743 | 3673 | 809.9 |
| A | 4 | 2 | 126878 | 152.13 | 3743 | 3673 | 809.9 |
| A | 9 | 143 | 65855 | 76.78 | 3743 | 3673 | 809.9 |
| B | 3 | 64 | 2127522 | 3105.56 | 3677 | 3585 | 683.9 |
| B | 15 | 222 | 1378745 | 2010.72 | 3677 | 3585 | 683.9 |
| B | 0 | 229 | 463897 | 673.05 | 3677 | 3585 | 683.9 |
| C | 4 | 254 | 3332006 | 4293.45 | 3541 | 3490 | 775.3 |
| C | 3 | 233 | 3095912 | 3988.91 | 3541 | 3490 | 775.3 |
| C | 0 | 207 | 105781 | 131.95 | 3541 | 3490 | 775.3 |
| D | 7 | 254 | 2552169 | 2919.68 | 3606 | 3499 | 872.9 |
| D | 13 | 104 | 635840 | 724.39 | 3606 | 3499 | 872.9 |
| D | 10 | 70 | 546619 | 622.18 | 3606 | 3499 | 872.9 |
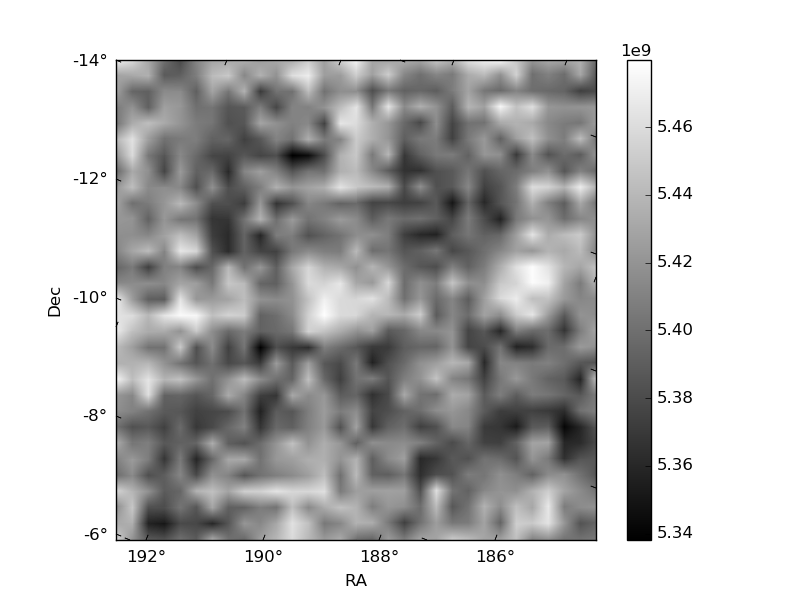
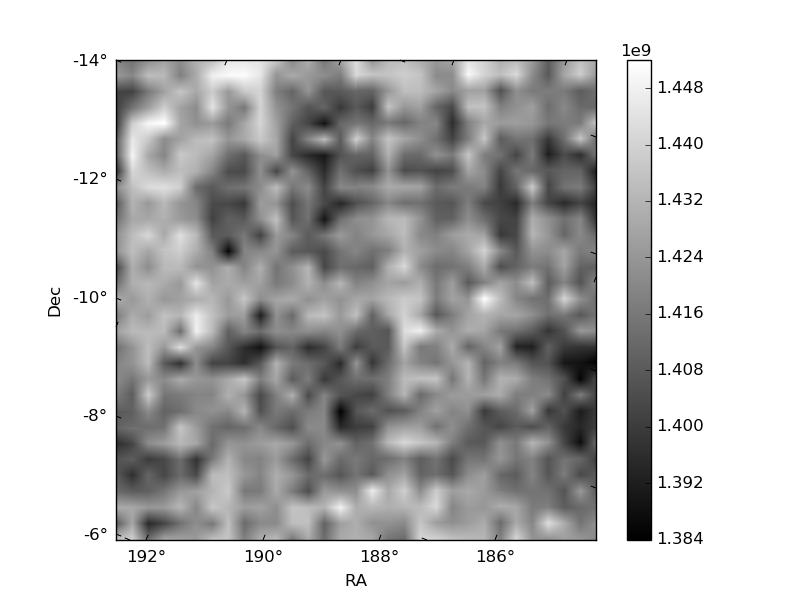
Histogram calculated using DETX and DETY for each event in the final _common_clean file
| Quadrant A |  |
 |
Quadrant B |
|---|---|---|---|
| Quadrant D |  |
 |
Quadrant C |
| Plot type | Count rate plots | Images |
|---|---|---|
| Comparison with Poisson distribution Blue bars denote a histogram of data divided into 1 sec bins. Red curve is a Poisson curve with rate = median count rate of data. |
 |
 |
| Quadrant-wise count rates Data is divided into 100 sec bins |
 |
|
| Module-wise count rates for Quadrant A Data is divided into 100 sec bins |
 |
 |
| Module-wise count rates for Quadrant B Data is divided into 100 sec bins |
 |
 |
| Module-wise count rates for Quadrant C Data is divided into 100 sec bins |
 |
 |
| Module-wise count rates for Quadrant D Data is divided into 100 sec bins |
 |
 |
| Parameter | Plot |
|---|---|
| CZT HV Monitor | 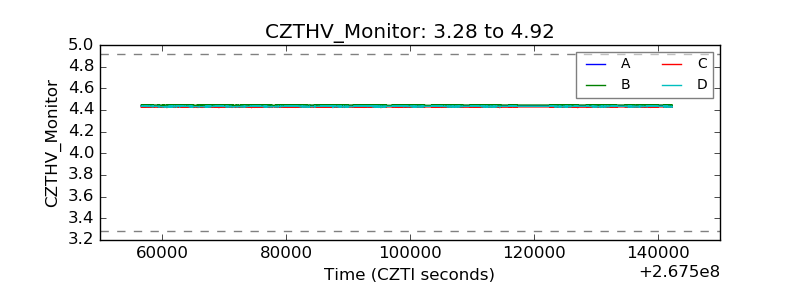 |
| D_VDD |  |
| Temperature 1 |  |
| Veto HV Monitor |  |
| Veto LLD | 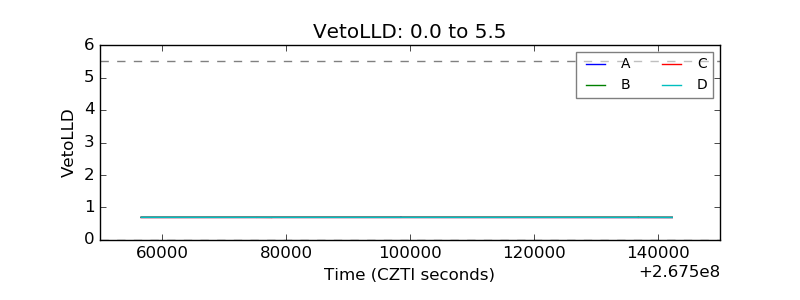 |
| Alpha Counter |  |
| _CPM_Rate | 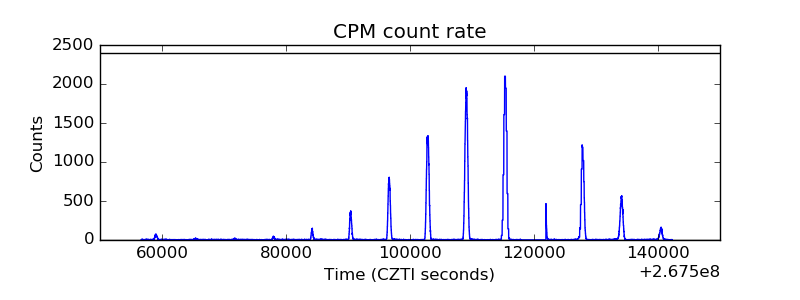 |
| CZT Counter |  |
| +2.5 Volts monitor |  |
| +5 Volts monitor |  |
| _ROLL_ROT |  |
| _Roll_DEC |  |
| _Roll_RA |  |
| Veto Counter | 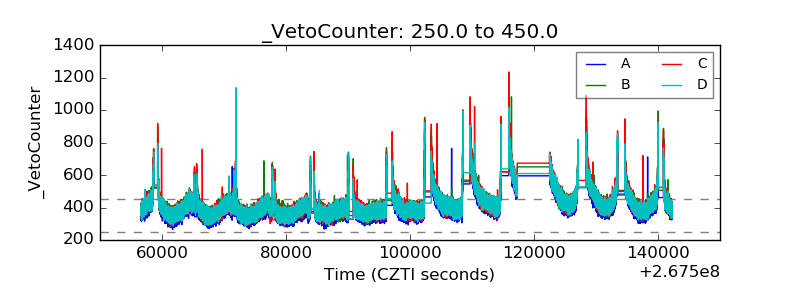 |