| Param | Original file | Final file |
|---|---|---|
| Filename | modeM0/AS1A04_130T03_9000002186cztM0_level2_bc.evt | modeM0/AS1A04_130T03_9000002186cztM0_level2_quad_clean.evt |
| Size (bytes) | 638,210,880 | 219,625,920 |
| Size | 608.6 MB | 209.5 MB |
| Events in quadrant A | 4,166,879 | 1,410,739 |
| Events in quadrant B | 4,619,119 | 1,391,334 |
| Events in quadrant C | 5,105,050 | 1,331,314 |
| Events in quadrant D | 4,265,591 | 1,338,984 |
| Mode SS | |||
|---|---|---|---|
| Quadrant | BADHDUFLAG | Total packets | Discarded packets |
| A | 0 | 348 | 0 |
| B | 0 | 348 | 0 |
| C | 0 | 348 | 0 |
| D | 0 | 348 | 0 |
| Mode M0 | |||
|---|---|---|---|
| Quadrant | BADHDUFLAG | Total packets | Discarded packets |
| A | 0 | 37328 | 0 |
| B | 0 | 39255 | 0 |
| C | 0 | 41303 | 0 |
| D | 0 | 37333 | 0 |
| Mode M9 | |||
|---|---|---|---|
| Quadrant | BADHDUFLAG | Total packets | Discarded packets |
| A | 0 | 45 | 0 |
| B | 0 | 45 | 0 |
| C | 0 | 45 | 0 |
| D | 0 | 45 | 0 |
| Quadrant | Total seconds | Saturated seconds | Saturation percentage |
|---|---|---|---|
| A | 17106 | 335 | 1.958377% |
| B | 17106 | 460 | 2.689115% |
| C | 17106 | 243 | 1.420554% |
| D | 17106 | 270 | 1.578394% |
Noise dominated data is calculated using 1-second bins in cleaned event files. If a bin has >2000 counts, and if more than 50% of those come from <1% of pixels, then it is considered to be noise-dominated and hence unusable.
| Quadrant | # 1 sec bins | Bins with >0 counts | Bins with >2000 counts | High rate bins dominated by noise | Noise dominated (total time) | Noise dominated (detector-on time) | Marked lightcurve |
|---|---|---|---|---|---|---|---|
| A | 20816 | 17107 | 1 | 1 | 0.00% | 0.01% |  |
| B | 20816 | 17106 | 10 | 10 | 0.05% | 0.06% |  |
| C | 20816 | 17107 | 0 | 0 | 0.00% | 0.00% |  |
| D | 20817 | 17107 | 8 | 8 | 0.04% | 0.05% | 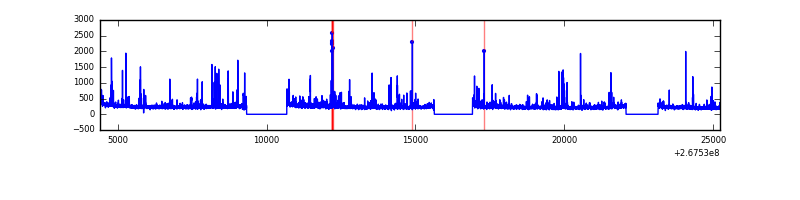 |
Top three noisy pixels from each quadrant. If the there are fewer than three noisy pixels in the level2.evt file, extra rows are filled as -1
| Pixel properties | Quadrant properties | ||||||
|---|---|---|---|---|---|---|---|
| Quadrant | DetID | PixID | Counts | Sigma | Mean | Median | Sigma |
| A | 12 | 189 | 144376 | 653.31 | 1021 | 1004 | 219.5 |
| A | 14 | 237 | 44675 | 199.0 | 1021 | 1004 | 219.5 |
| A | 4 | 2 | 41378 | 183.97 | 1021 | 1004 | 219.5 |
| B | 3 | 64 | 234113 | 1238.6 | 1011 | 990 | 188.2 |
| B | 0 | 219 | 176420 | 932.07 | 1011 | 990 | 188.2 |
| B | 4 | 173 | 63612 | 332.71 | 1011 | 990 | 188.2 |
| C | 3 | 233 | 1223205 | 5850.76 | 957 | 947 | 208.9 |
| C | 0 | 207 | 122352 | 581.15 | 957 | 947 | 208.9 |
| C | 10 | 22 | 10395 | 45.23 | 957 | 947 | 208.9 |
| D | 12 | 110 | 98011 | 435.8 | 985 | 960 | 222.7 |
| D | 10 | 199 | 78638 | 348.8 | 985 | 960 | 222.7 |
| D | 2 | 234 | 63118 | 279.11 | 985 | 960 | 222.7 |
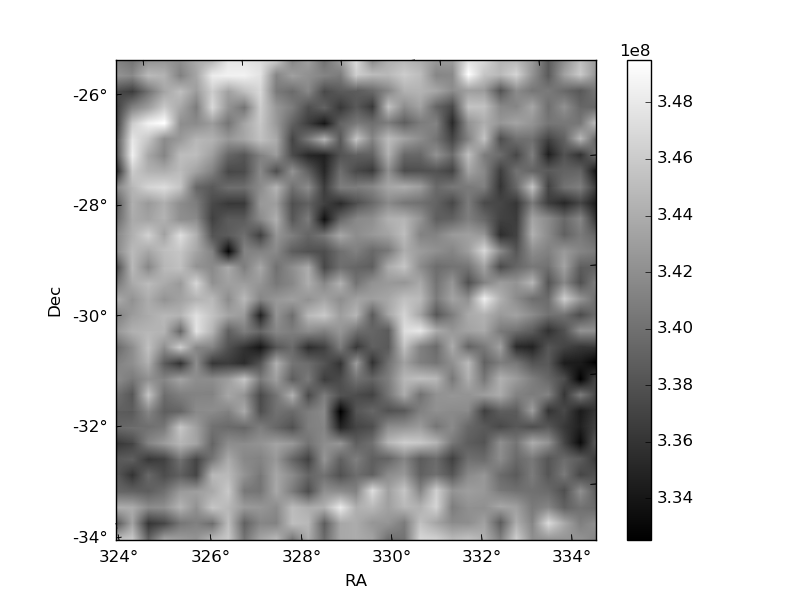
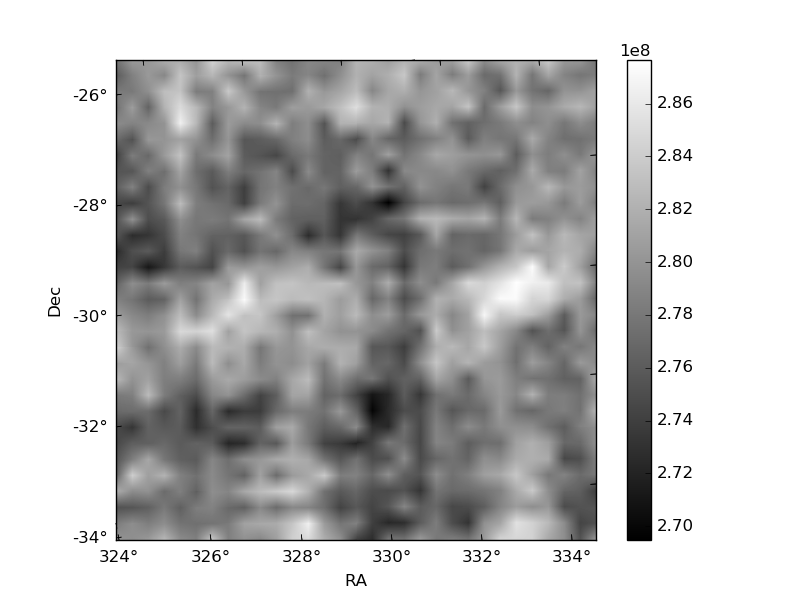
Histogram calculated using DETX and DETY for each event in the final _common_clean file
| Quadrant A | 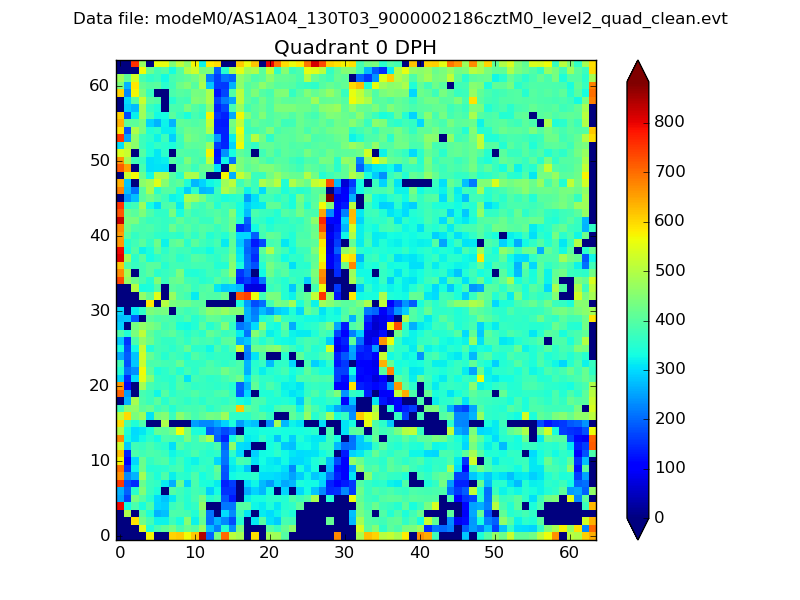 |
 |
Quadrant B |
|---|---|---|---|
| Quadrant D | 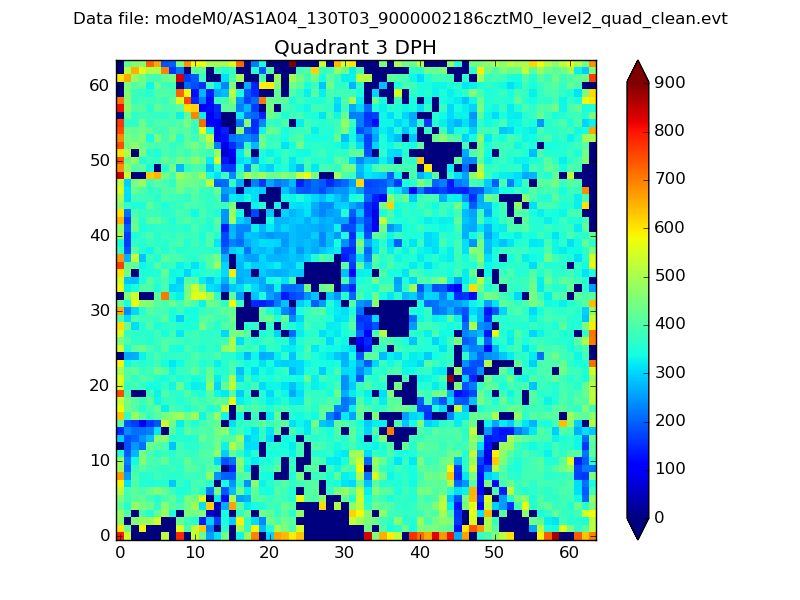 |
 |
Quadrant C |
| Plot type | Count rate plots | Images |
|---|---|---|
| Comparison with Poisson distribution Blue bars denote a histogram of data divided into 1 sec bins. Red curve is a Poisson curve with rate = median count rate of data. |
 |
 |
| Quadrant-wise count rates Data is divided into 100 sec bins |
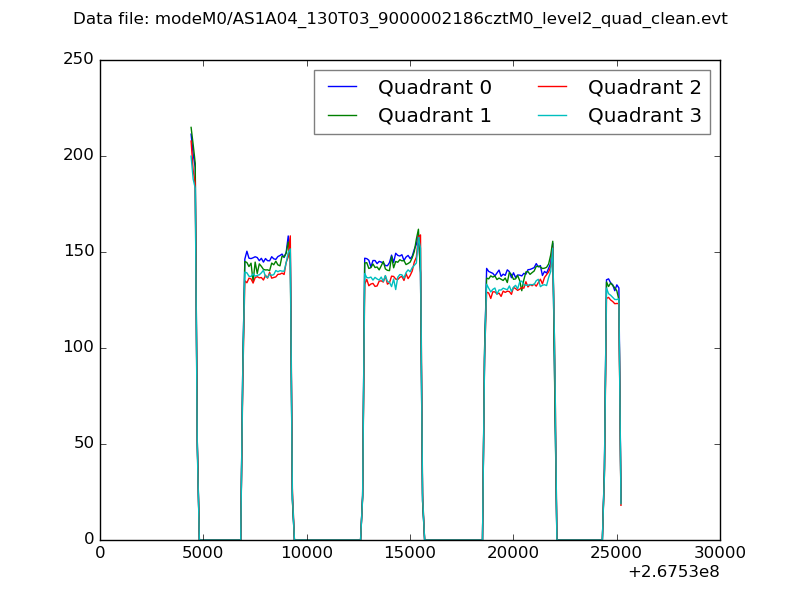 |
|
| Module-wise count rates for Quadrant A Data is divided into 100 sec bins |
 |
 |
| Module-wise count rates for Quadrant B Data is divided into 100 sec bins |
 |
 |
| Module-wise count rates for Quadrant C Data is divided into 100 sec bins |
 |
 |
| Module-wise count rates for Quadrant D Data is divided into 100 sec bins |
 |
 |
| Parameter | Plot |
|---|---|
| CZT HV Monitor |  |
| D_VDD |  |
| Temperature 1 | 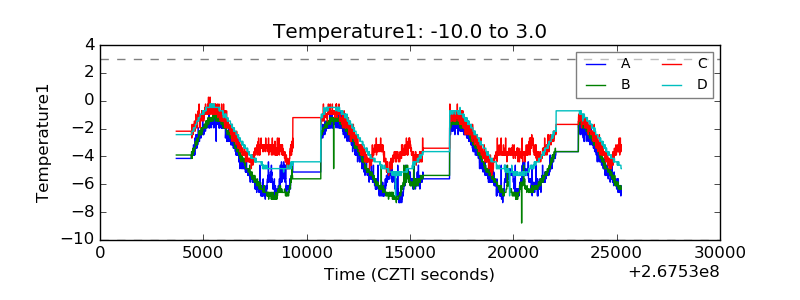 |
| Veto HV Monitor |  |
| Veto LLD | 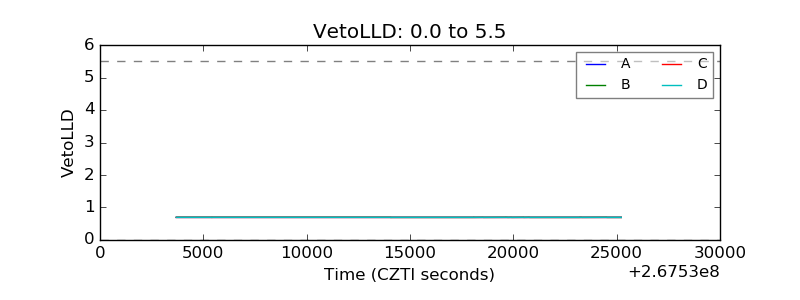 |
| Alpha Counter |  |
| _CPM_Rate |  |
| CZT Counter | 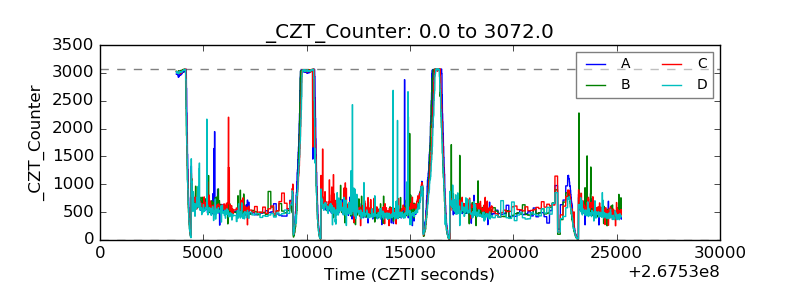 |
| +2.5 Volts monitor |  |
| +5 Volts monitor |  |
| _ROLL_ROT |  |
| _Roll_DEC |  |
| _Roll_RA | 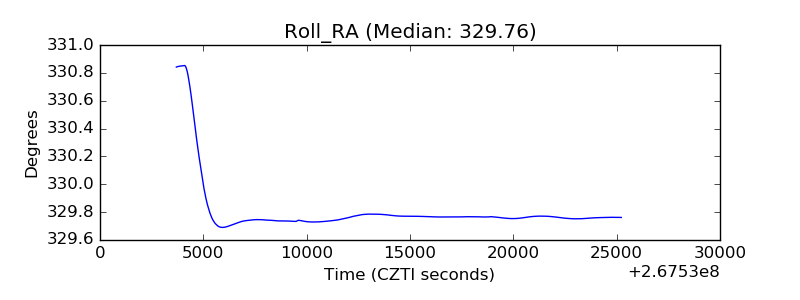 |
| Veto Counter |  |