| Param | Original file | Final file |
|---|---|---|
| Filename | modeM0/AS1A04_022T02_9000002184cztM0_level2_bc.evt | modeM0/AS1A04_022T02_9000002184cztM0_level2_quad_clean.evt |
| Size (bytes) | 4,892,443,200 | 1,648,958,400 |
| Size | 4.6 GB | 1.5 GB |
| Events in quadrant A | 29,194,959 | 10,491,335 |
| Events in quadrant B | 41,112,737 | 10,283,534 |
| Events in quadrant C | 39,803,084 | 10,274,497 |
| Events in quadrant D | 29,366,877 | 10,147,545 |
| Mode SS | |||
|---|---|---|---|
| Quadrant | BADHDUFLAG | Total packets | Discarded packets |
| A | 0 | 2598 | 0 |
| B | 0 | 2598 | 0 |
| C | 0 | 2598 | 0 |
| D | 0 | 2598 | 0 |
| Mode M0 | |||
|---|---|---|---|
| Quadrant | BADHDUFLAG | Total packets | Discarded packets |
| A | 0 | 271543 | 0 |
| B | 0 | 322248 | 0 |
| C | 0 | 313289 | 0 |
| D | 0 | 273163 | 0 |
| Mode M9 | |||
|---|---|---|---|
| Quadrant | BADHDUFLAG | Total packets | Discarded packets |
| A | 0 | 184 | 0 |
| B | 0 | 184 | 0 |
| C | 0 | 184 | 0 |
| D | 0 | 184 | 0 |
| Quadrant | Total seconds | Saturated seconds | Saturation percentage |
|---|---|---|---|
| A | 127690 | 1431 | 1.120683% |
| B | 127690 | 6163 | 4.826533% |
| C | 127690 | 1791 | 1.402616% |
| D | 127690 | 1414 | 1.107369% |
Noise dominated data is calculated using 1-second bins in cleaned event files. If a bin has >2000 counts, and if more than 50% of those come from <1% of pixels, then it is considered to be noise-dominated and hence unusable.
| Quadrant | # 1 sec bins | Bins with >0 counts | Bins with >2000 counts | High rate bins dominated by noise | Noise dominated (total time) | Noise dominated (detector-on time) | Marked lightcurve |
|---|---|---|---|---|---|---|---|
| A | 146102 | 127698 | 13 | 13 | 0.01% | 0.01% |  |
| B | 146102 | 127691 | 449 | 449 | 0.31% | 0.35% | 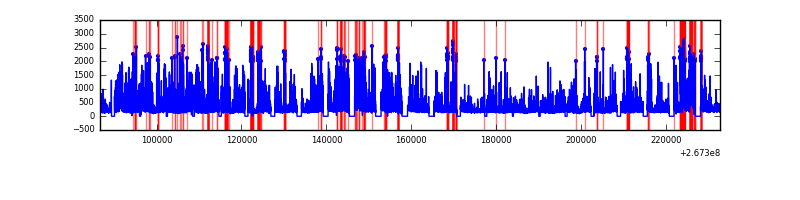 |
| C | 146102 | 127695 | 40 | 40 | 0.03% | 0.03% |  |
| D | 146102 | 127693 | 125 | 125 | 0.09% | 0.10% |  |
Top three noisy pixels from each quadrant. If the there are fewer than three noisy pixels in the level2.evt file, extra rows are filled as -1
| Pixel properties | Quadrant properties | ||||||
|---|---|---|---|---|---|---|---|
| Quadrant | DetID | PixID | Counts | Sigma | Mean | Median | Sigma |
| A | 12 | 189 | 1506898 | 1035.38 | 6648 | 6518 | 1449.1 |
| A | 14 | 237 | 736250 | 503.57 | 6648 | 6518 | 1449.1 |
| A | 0 | 23 | 404751 | 274.81 | 6648 | 6518 | 1449.1 |
| B | 10 | 16 | 8029965 | 6529.74 | 6507 | 6341 | 1228.8 |
| B | 3 | 64 | 4081527 | 3316.44 | 6507 | 6341 | 1228.8 |
| B | 0 | 219 | 1153488 | 933.56 | 6507 | 6341 | 1228.8 |
| C | 3 | 233 | 12395457 | 8876.94 | 6368 | 6277 | 1395.7 |
| C | 4 | 254 | 1967021 | 1404.89 | 6368 | 6277 | 1395.7 |
| C | 0 | 207 | 244770 | 170.88 | 6368 | 6277 | 1395.7 |
| D | 15 | 0 | 2148542 | 1300.14 | 6484 | 6303 | 1647.7 |
| D | 10 | 70 | 525302 | 314.99 | 6484 | 6303 | 1647.7 |
| D | 2 | 234 | 501442 | 300.5 | 6484 | 6303 | 1647.7 |
Histogram calculated using DETX and DETY for each event in the final _common_clean file
| Quadrant A |  |
 |
Quadrant B |
|---|---|---|---|
| Quadrant D |  |
 |
Quadrant C |
| Plot type | Count rate plots | Images |
|---|---|---|
| Comparison with Poisson distribution Blue bars denote a histogram of data divided into 1 sec bins. Red curve is a Poisson curve with rate = median count rate of data. |
 |
 |
| Quadrant-wise count rates Data is divided into 100 sec bins |
 |
|
| Module-wise count rates for Quadrant A Data is divided into 100 sec bins |
 |
 |
| Module-wise count rates for Quadrant B Data is divided into 100 sec bins |
 |
 |
| Module-wise count rates for Quadrant C Data is divided into 100 sec bins |
 |
 |
| Module-wise count rates for Quadrant D Data is divided into 100 sec bins |
 |
 |
| Parameter | Plot |
|---|---|
| CZT HV Monitor |  |
| D_VDD |  |
| Temperature 1 |  |
| Veto HV Monitor |  |
| Veto LLD |  |
| Alpha Counter |  |
| _CPM_Rate |  |
| CZT Counter |  |
| +2.5 Volts monitor |  |
| +5 Volts monitor |  |
| _ROLL_ROT |  |
| _Roll_DEC | 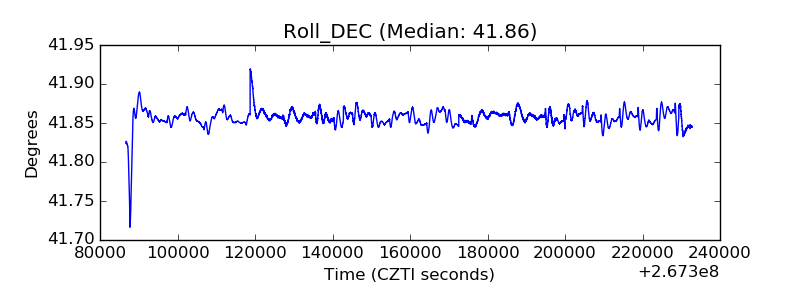 |
| _Roll_RA |  |
| Veto Counter |  |