| Param | Original file | Final file |
|---|---|---|
| Filename | modeM0/AS1A04_022T06_9000002182cztM0_level2_bc.evt | modeM0/AS1A04_022T06_9000002182cztM0_level2_quad_clean.evt |
| Size (bytes) | 5,152,939,200 | 1,539,331,200 |
| Size | 4.8 GB | 1.4 GB |
| Events in quadrant A | 46,829,495 | 9,658,899 |
| Events in quadrant B | 30,727,779 | 9,818,492 |
| Events in quadrant C | 38,293,569 | 9,482,140 |
| Events in quadrant D | 32,079,525 | 9,478,129 |
| Mode SS | |||
|---|---|---|---|
| Quadrant | BADHDUFLAG | Total packets | Discarded packets |
| A | 0 | 2430 | 0 |
| B | 0 | 2430 | 0 |
| C | 0 | 2430 | 0 |
| D | 0 | 2430 | 0 |
| Mode M0 | |||
|---|---|---|---|
| Quadrant | BADHDUFLAG | Total packets | Discarded packets |
| A | 0 | 323233 | 0 |
| B | 0 | 268400 | 0 |
| C | 0 | 297782 | 0 |
| D | 0 | 268847 | 0 |
| Mode M9 | |||
|---|---|---|---|
| Quadrant | BADHDUFLAG | Total packets | Discarded packets |
| A | 0 | 222 | 0 |
| B | 0 | 222 | 0 |
| C | 0 | 222 | 0 |
| D | 0 | 222 | 0 |
| Quadrant | Total seconds | Saturated seconds | Saturation percentage |
|---|---|---|---|
| A | 119463 | 7629 | 6.386078% |
| B | 119488 | 2207 | 1.847047% |
| C | 119488 | 5147 | 4.307546% |
| D | 119488 | 1854 | 1.551620% |
Noise dominated data is calculated using 1-second bins in cleaned event files. If a bin has >2000 counts, and if more than 50% of those come from <1% of pixels, then it is considered to be noise-dominated and hence unusable.
| Quadrant | # 1 sec bins | Bins with >0 counts | Bins with >2000 counts | High rate bins dominated by noise | Noise dominated (total time) | Noise dominated (detector-on time) | Marked lightcurve |
|---|---|---|---|---|---|---|---|
| A | 141414 | 119468 | 857 | 857 | 0.61% | 0.72% |  |
| B | 141414 | 119490 | 82 | 82 | 0.06% | 0.07% |  |
| C | 141414 | 119494 | 93 | 93 | 0.07% | 0.08% |  |
| D | 141413 | 119490 | 180 | 180 | 0.13% | 0.15% |  |
Top three noisy pixels from each quadrant. If the there are fewer than three noisy pixels in the level2.evt file, extra rows are filled as -1
| Pixel properties | Quadrant properties | ||||||
|---|---|---|---|---|---|---|---|
| Quadrant | DetID | PixID | Counts | Sigma | Mean | Median | Sigma |
| A | 8 | 15 | 15483687 | 11360.24 | 6284 | 6175 | 1362.4 |
| A | 14 | 237 | 3761153 | 2756.09 | 6284 | 6175 | 1362.4 |
| A | 12 | 189 | 2112362 | 1545.91 | 6284 | 6175 | 1362.4 |
| B | 0 | 219 | 1130686 | 942.13 | 6389 | 6235 | 1193.5 |
| B | 3 | 64 | 1116438 | 930.19 | 6389 | 6235 | 1193.5 |
| B | 10 | 16 | 741133 | 615.74 | 6389 | 6235 | 1193.5 |
| C | 4 | 254 | 7548683 | 5742.87 | 6056 | 5986 | 1313.4 |
| C | 3 | 233 | 6323359 | 4809.93 | 6056 | 5986 | 1313.4 |
| C | 0 | 207 | 447323 | 336.03 | 6056 | 5986 | 1313.4 |
| D | 5 | 222 | 3346418 | 2142.55 | 6256 | 6084 | 1559.0 |
| D | 8 | 195 | 1309485 | 836.02 | 6256 | 6084 | 1559.0 |
| D | 15 | 0 | 832105 | 529.82 | 6256 | 6084 | 1559.0 |
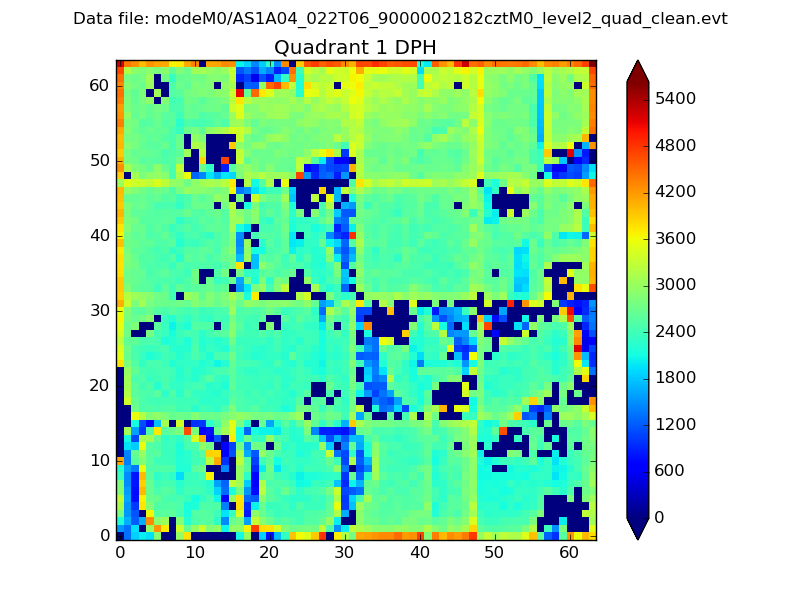
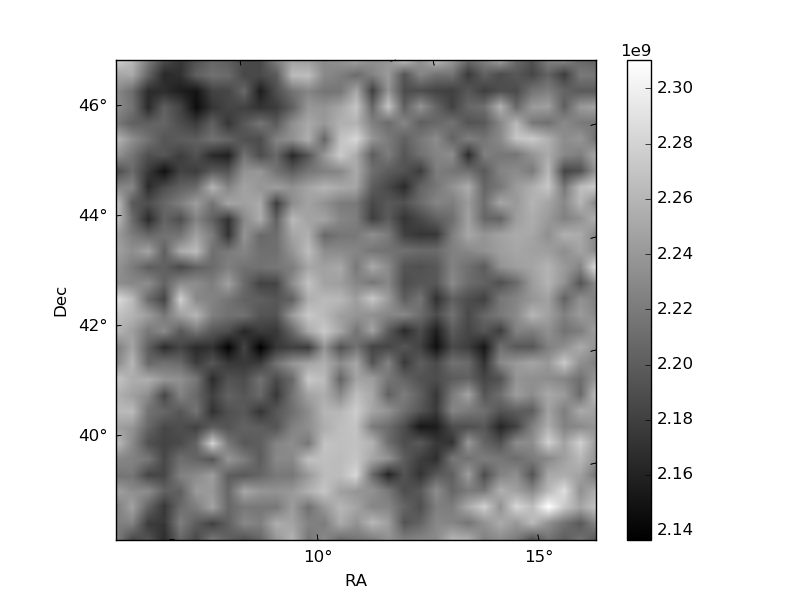
Histogram calculated using DETX and DETY for each event in the final _common_clean file
| Quadrant A |  |
 |
Quadrant B |
|---|---|---|---|
| Quadrant D | 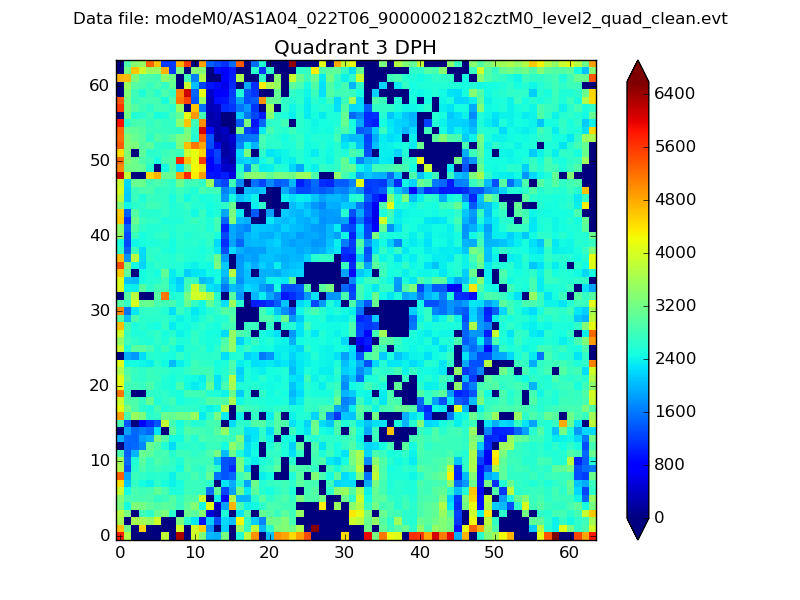 |
 |
Quadrant C |
| Plot type | Count rate plots | Images |
|---|---|---|
| Comparison with Poisson distribution Blue bars denote a histogram of data divided into 1 sec bins. Red curve is a Poisson curve with rate = median count rate of data. |
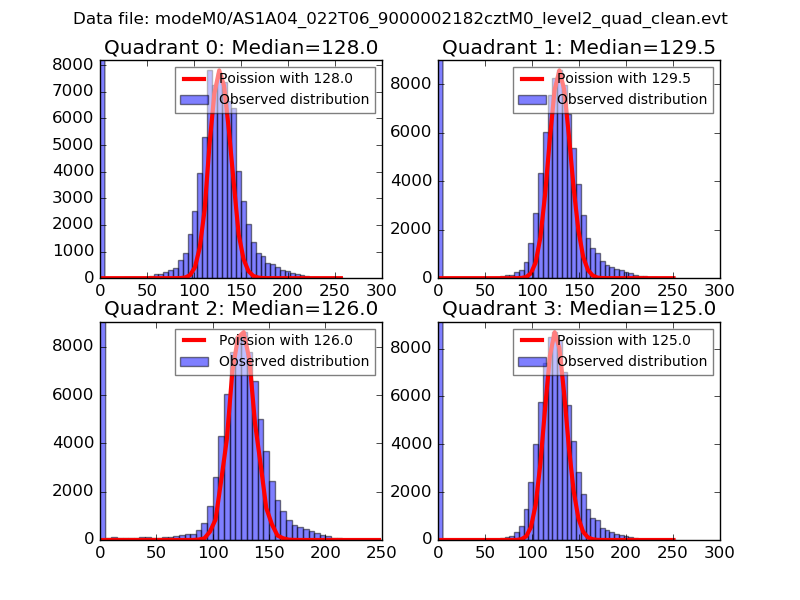 |
 |
| Quadrant-wise count rates Data is divided into 100 sec bins |
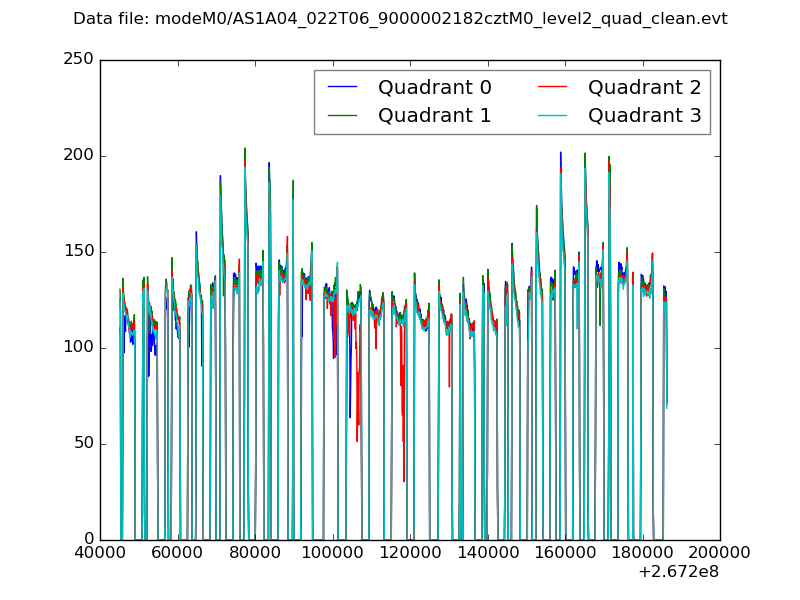 |
|
| Module-wise count rates for Quadrant A Data is divided into 100 sec bins |
 |
 |
| Module-wise count rates for Quadrant B Data is divided into 100 sec bins |
 |
 |
| Module-wise count rates for Quadrant C Data is divided into 100 sec bins |
 |
 |
| Module-wise count rates for Quadrant D Data is divided into 100 sec bins |
 |
 |
| Parameter | Plot |
|---|---|
| CZT HV Monitor |  |
| D_VDD | 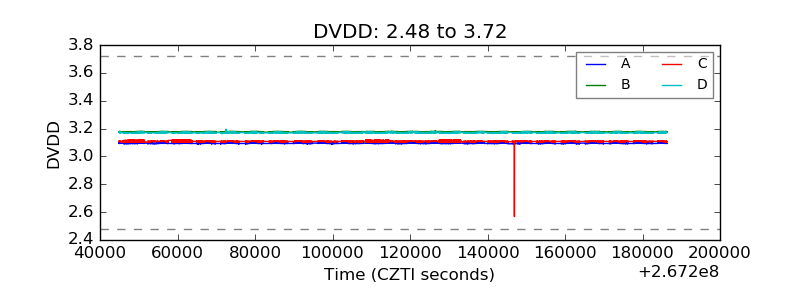 |
| Temperature 1 | 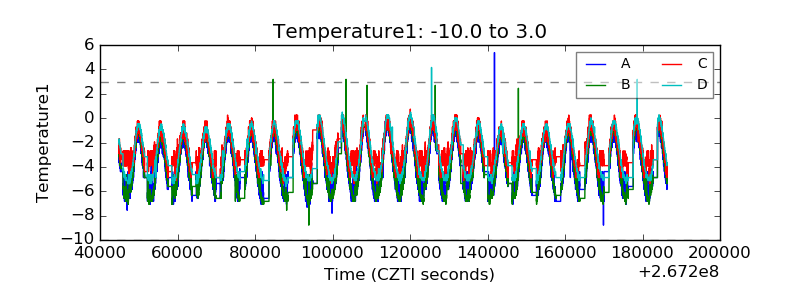 |
| Veto HV Monitor |  |
| Veto LLD | 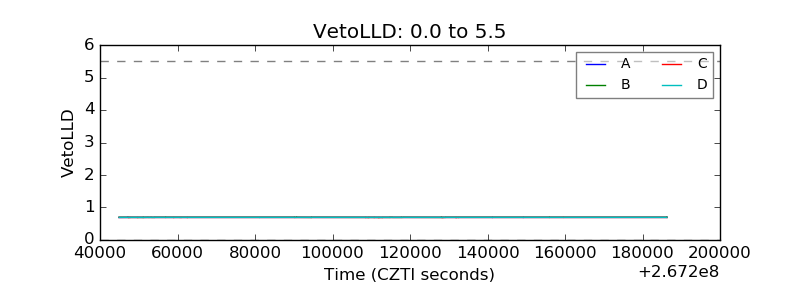 |
| Alpha Counter |  |
| _CPM_Rate |  |
| CZT Counter |  |
| +2.5 Volts monitor | 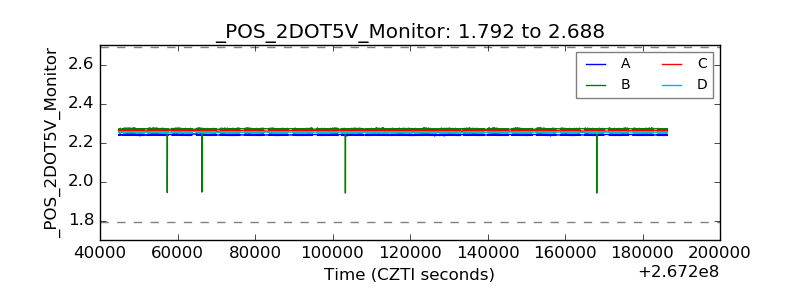 |
| +5 Volts monitor |  |
| _ROLL_ROT | 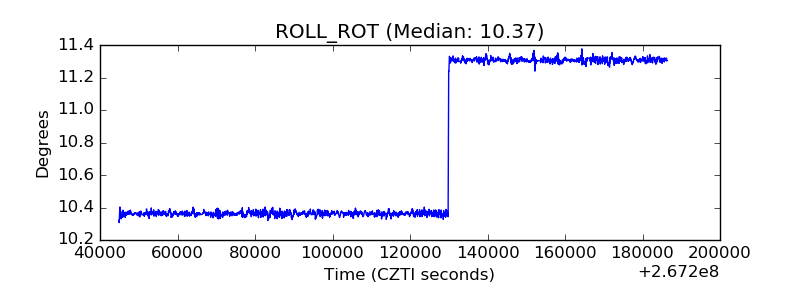 |
| _Roll_DEC |  |
| _Roll_RA |  |
| Veto Counter |  |