| Param | Original file | Final file |
|---|---|---|
| Filename | modeM0/AS1G08_081T01_9000002178cztM0_level2_bc.evt | modeM0/AS1G08_081T01_9000002178cztM0_level2_quad_clean.evt |
| Size (bytes) | 2,434,553,280 | 893,151,360 |
| Size | 2.3 GB | 851.8 MB |
| Events in quadrant A | 23,089,531 | 5,700,336 |
| Events in quadrant B | 15,235,370 | 5,697,413 |
| Events in quadrant C | 16,110,087 | 5,571,424 |
| Events in quadrant D | 14,843,130 | 5,601,526 |
| Mode SS | |||
|---|---|---|---|
| Quadrant | BADHDUFLAG | Total packets | Discarded packets |
| A | 0 | 1330 | 0 |
| B | 0 | 1330 | 0 |
| C | 0 | 1330 | 0 |
| D | 0 | 1330 | 0 |
| Mode M0 | |||
|---|---|---|---|
| Quadrant | BADHDUFLAG | Total packets | Discarded packets |
| A | 0 | 164917 | 0 |
| B | 0 | 142047 | 0 |
| C | 0 | 140362 | 0 |
| D | 0 | 139218 | 0 |
| Mode M9 | |||
|---|---|---|---|
| Quadrant | BADHDUFLAG | Total packets | Discarded packets |
| A | 0 | 111 | 0 |
| B | 0 | 111 | 0 |
| C | 0 | 111 | 0 |
| D | 0 | 111 | 0 |
| Quadrant | Total seconds | Saturated seconds | Saturation percentage |
|---|---|---|---|
| A | 65372 | 1803 | 2.758062% |
| B | 65372 | 1000 | 1.529707% |
| C | 65372 | 601 | 0.919354% |
| D | 65372 | 638 | 0.975953% |
Noise dominated data is calculated using 1-second bins in cleaned event files. If a bin has >2000 counts, and if more than 50% of those come from <1% of pixels, then it is considered to be noise-dominated and hence unusable.
| Quadrant | # 1 sec bins | Bins with >0 counts | Bins with >2000 counts | High rate bins dominated by noise | Noise dominated (total time) | Noise dominated (detector-on time) | Marked lightcurve |
|---|---|---|---|---|---|---|---|
| A | 76413 | 65363 | 280 | 280 | 0.37% | 0.43% |  |
| B | 76413 | 65364 | 5 | 5 | 0.01% | 0.01% |  |
| C | 76413 | 65365 | 4 | 4 | 0.01% | 0.01% |  |
| D | 76413 | 65364 | 9 | 9 | 0.01% | 0.01% |  |
Top three noisy pixels from each quadrant. If the there are fewer than three noisy pixels in the level2.evt file, extra rows are filled as -1
| Pixel properties | Quadrant properties | ||||||
|---|---|---|---|---|---|---|---|
| Quadrant | DetID | PixID | Counts | Sigma | Mean | Median | Sigma |
| A | 8 | 15 | 8925677 | 11678.84 | 3535 | 3473 | 764.0 |
| A | 12 | 189 | 424499 | 551.11 | 3535 | 3473 | 764.0 |
| A | 9 | 143 | 59587 | 73.45 | 3535 | 3473 | 764.0 |
| B | 0 | 230 | 281858 | 421.08 | 3530 | 3444 | 661.2 |
| B | 0 | 205 | 267242 | 398.97 | 3530 | 3444 | 661.2 |
| B | 0 | 229 | 181641 | 269.51 | 3530 | 3444 | 661.2 |
| C | 3 | 233 | 2544570 | 3420.84 | 3423 | 3381 | 742.9 |
| C | 6 | 96 | 79303 | 102.2 | 3423 | 3381 | 742.9 |
| C | 4 | 254 | 45590 | 56.82 | 3423 | 3381 | 742.9 |
| D | 12 | 16 | 785522 | 960.52 | 3490 | 3394 | 814.3 |
| D | 2 | 234 | 234275 | 283.54 | 3490 | 3394 | 814.3 |
| D | 13 | 172 | 115945 | 138.22 | 3490 | 3394 | 814.3 |
Histogram calculated using DETX and DETY for each event in the final _common_clean file
| Quadrant A |  |
 |
Quadrant B |
|---|---|---|---|
| Quadrant D | 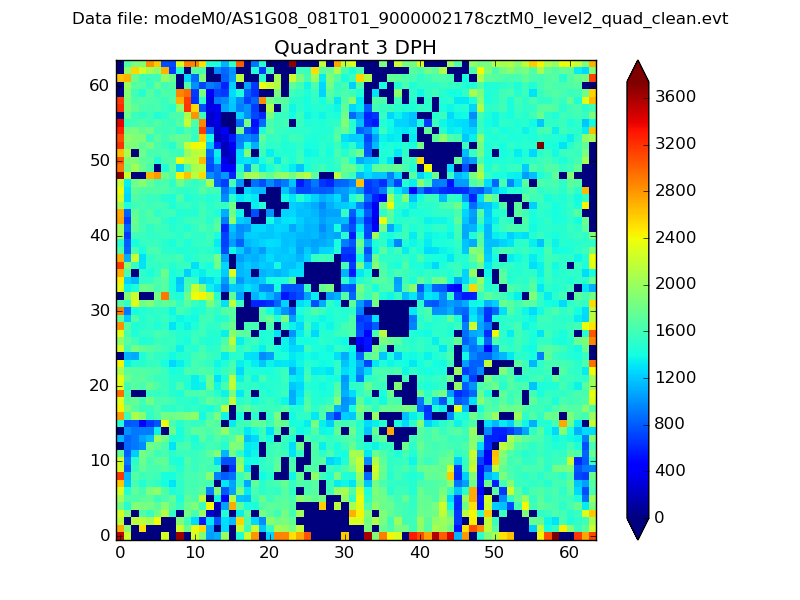 |
 |
Quadrant C |
| Plot type | Count rate plots | Images |
|---|---|---|
| Comparison with Poisson distribution Blue bars denote a histogram of data divided into 1 sec bins. Red curve is a Poisson curve with rate = median count rate of data. |
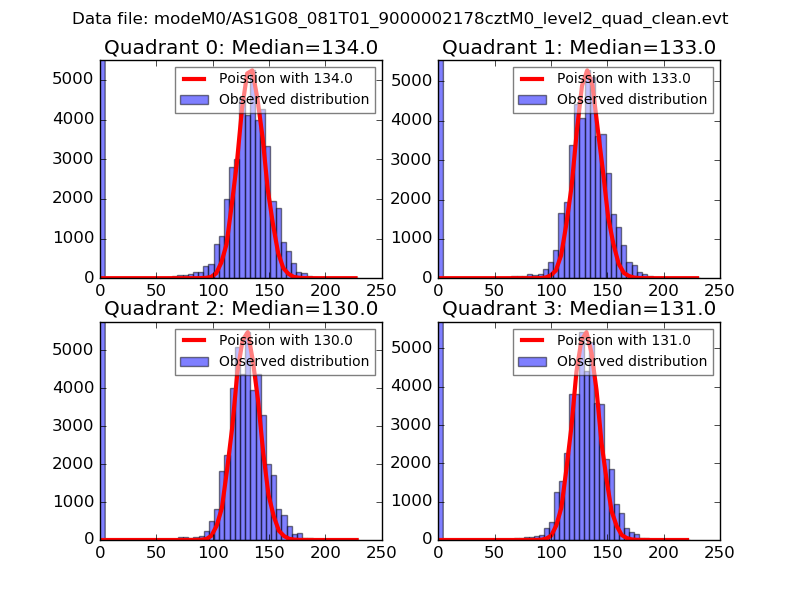 |
 |
| Quadrant-wise count rates Data is divided into 100 sec bins |
 |
|
| Module-wise count rates for Quadrant A Data is divided into 100 sec bins |
 |
 |
| Module-wise count rates for Quadrant B Data is divided into 100 sec bins |
 |
 |
| Module-wise count rates for Quadrant C Data is divided into 100 sec bins |
 |
 |
| Module-wise count rates for Quadrant D Data is divided into 100 sec bins |
 |
 |
| Parameter | Plot |
|---|---|
| CZT HV Monitor |  |
| D_VDD | 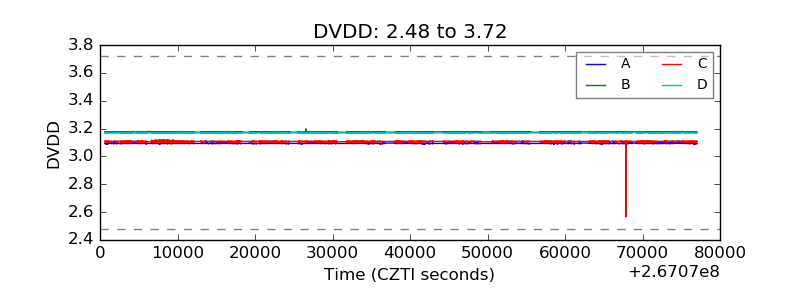 |
| Temperature 1 |  |
| Veto HV Monitor |  |
| Veto LLD |  |
| Alpha Counter |  |
| _CPM_Rate |  |
| CZT Counter | 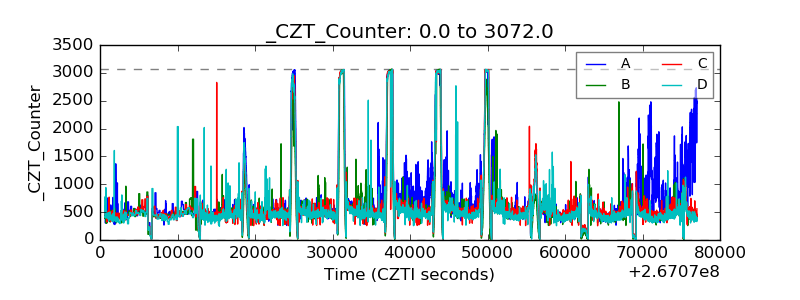 |
| +2.5 Volts monitor |  |
| +5 Volts monitor |  |
| _ROLL_ROT |  |
| _Roll_DEC |  |
| _Roll_RA |  |
| Veto Counter |  |