| Param | Original file | Final file |
|---|---|---|
| Filename | modeM0/AS1A04_203T01_9000002180cztM0_level2_bc.evt | modeM0/AS1A04_203T01_9000002180cztM0_level2_quad_clean.evt |
| Size (bytes) | 5,427,089,280 | 1,014,779,520 |
| Size | 5.1 GB | 967.8 MB |
| Events in quadrant A | 91,821,680 | 5,903,034 |
| Events in quadrant B | 22,640,732 | 6,464,038 |
| Events in quadrant C | 25,687,478 | 6,313,879 |
| Events in quadrant D | 18,474,523 | 6,257,227 |
| Mode SS | |||
|---|---|---|---|
| Quadrant | BADHDUFLAG | Total packets | Discarded packets |
| A | 0 | 1720 | 0 |
| B | 0 | 1720 | 0 |
| C | 0 | 1720 | 0 |
| D | 0 | 1720 | 0 |
| Mode M9 | |||
|---|---|---|---|
| Quadrant | BADHDUFLAG | Total packets | Discarded packets |
| A | 0 | 121 | 0 |
| B | 0 | 121 | 0 |
| C | 0 | 121 | 0 |
| D | 0 | 121 | 0 |
| Mode M0 | |||
|---|---|---|---|
| Quadrant | BADHDUFLAG | Total packets | Discarded packets |
| A | 0 | 408495 | 0 |
| B | 0 | 193424 | 0 |
| C | 0 | 202889 | 0 |
| D | 0 | 178000 | 0 |
| Quadrant | Total seconds | Saturated seconds | Saturation percentage |
|---|---|---|---|
| A | 84517 | 23685 | 28.023948% |
| B | 84517 | 2594 | 3.069205% |
| C | 84517 | 1390 | 1.644640% |
| D | 84517 | 850 | 1.005715% |
Noise dominated data is calculated using 1-second bins in cleaned event files. If a bin has >2000 counts, and if more than 50% of those come from <1% of pixels, then it is considered to be noise-dominated and hence unusable.
| Quadrant | # 1 sec bins | Bins with >0 counts | Bins with >2000 counts | High rate bins dominated by noise | Noise dominated (total time) | Noise dominated (detector-on time) | Marked lightcurve |
|---|---|---|---|---|---|---|---|
| A | 96643 | 84505 | 6771 | 6771 | 7.01% | 8.01% |  |
| B | 96643 | 84508 | 268 | 268 | 0.28% | 0.32% | 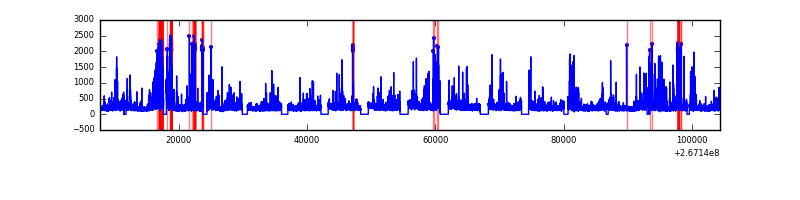 |
| C | 96643 | 84505 | 29 | 29 | 0.03% | 0.03% |  |
| D | 96643 | 84508 | 14 | 14 | 0.01% | 0.02% |  |
Top three noisy pixels from each quadrant. If the there are fewer than three noisy pixels in the level2.evt file, extra rows are filled as -1
| Pixel properties | Quadrant properties | ||||||
|---|---|---|---|---|---|---|---|
| Quadrant | DetID | PixID | Counts | Sigma | Mean | Median | Sigma |
| A | 8 | 15 | 74544591 | 82736.32 | 4120 | 4035 | 900.9 |
| A | 12 | 189 | 872691 | 964.17 | 4120 | 4035 | 900.9 |
| A | 0 | 23 | 250709 | 273.8 | 4120 | 4035 | 900.9 |
| B | 10 | 16 | 3506990 | 4211.26 | 4447 | 4336 | 831.7 |
| B | 4 | 142 | 638416 | 762.36 | 4447 | 4336 | 831.7 |
| B | 0 | 229 | 322757 | 382.84 | 4447 | 4336 | 831.7 |
| C | 3 | 233 | 6215591 | 6622.18 | 4316 | 4263 | 938.0 |
| C | 4 | 254 | 1875600 | 1995.12 | 4316 | 4263 | 938.0 |
| C | 9 | 236 | 390991 | 412.31 | 4316 | 4263 | 938.0 |
| D | 2 | 234 | 394211 | 367.99 | 4394 | 4262 | 1059.7 |
| D | 2 | 120 | 265465 | 246.5 | 4394 | 4262 | 1059.7 |
| D | 13 | 172 | 209577 | 193.75 | 4394 | 4262 | 1059.7 |
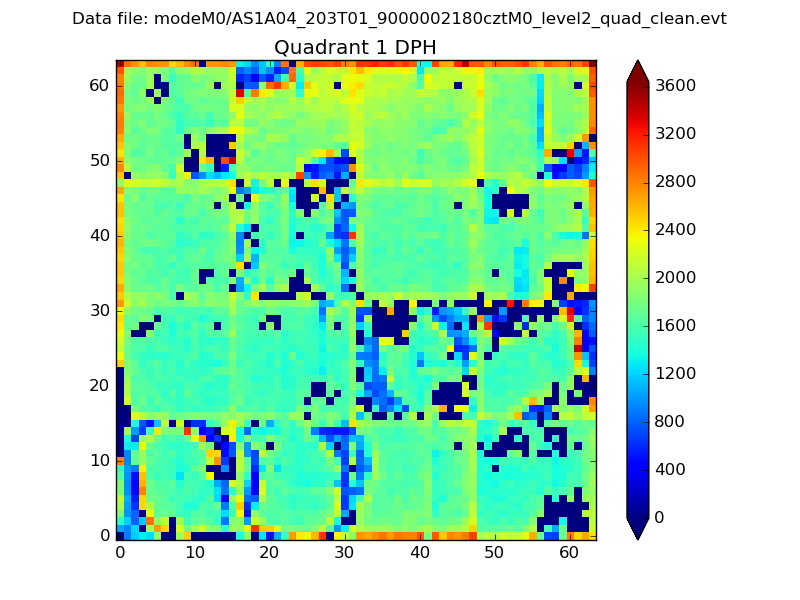
Histogram calculated using DETX and DETY for each event in the final _common_clean file
| Quadrant A |  |
 |
Quadrant B |
|---|---|---|---|
| Quadrant D | 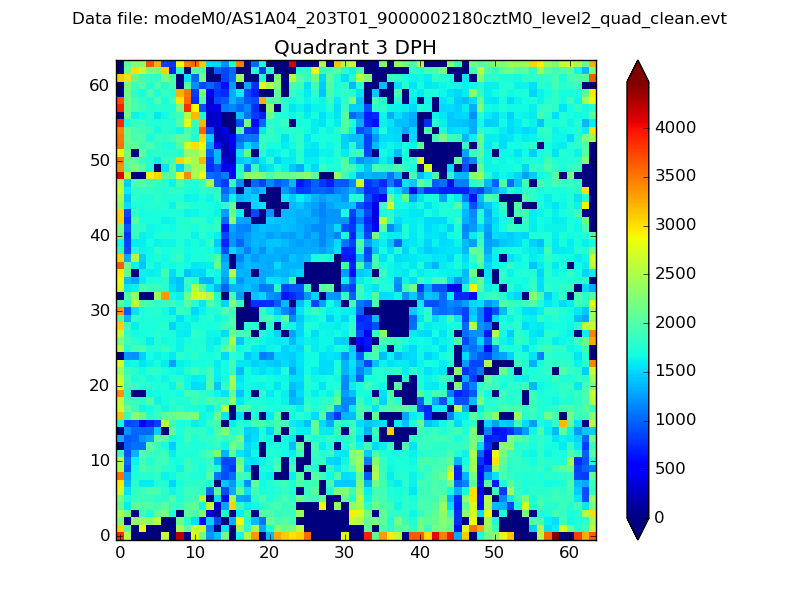 |
 |
Quadrant C |
| Plot type | Count rate plots | Images |
|---|---|---|
| Comparison with Poisson distribution Blue bars denote a histogram of data divided into 1 sec bins. Red curve is a Poisson curve with rate = median count rate of data. |
 |
 |
| Quadrant-wise count rates Data is divided into 100 sec bins |
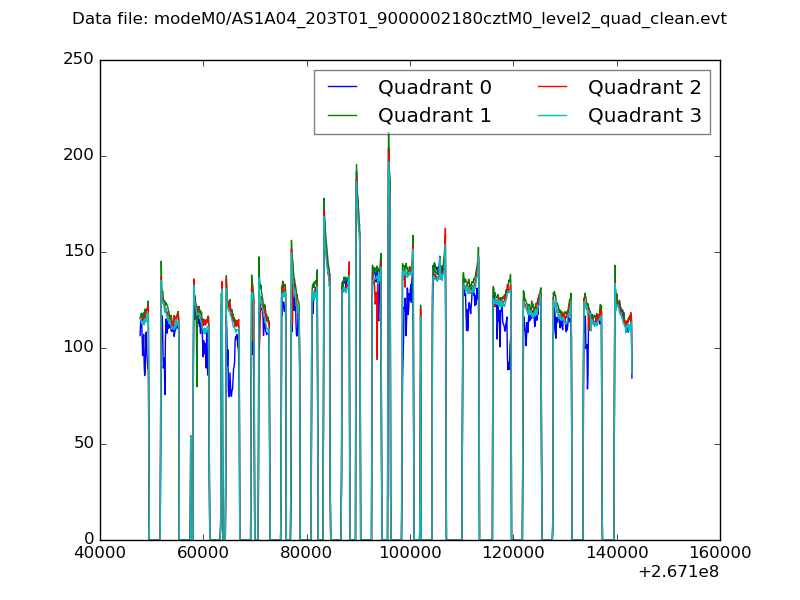 |
|
| Module-wise count rates for Quadrant A Data is divided into 100 sec bins |
 |
 |
| Module-wise count rates for Quadrant B Data is divided into 100 sec bins |
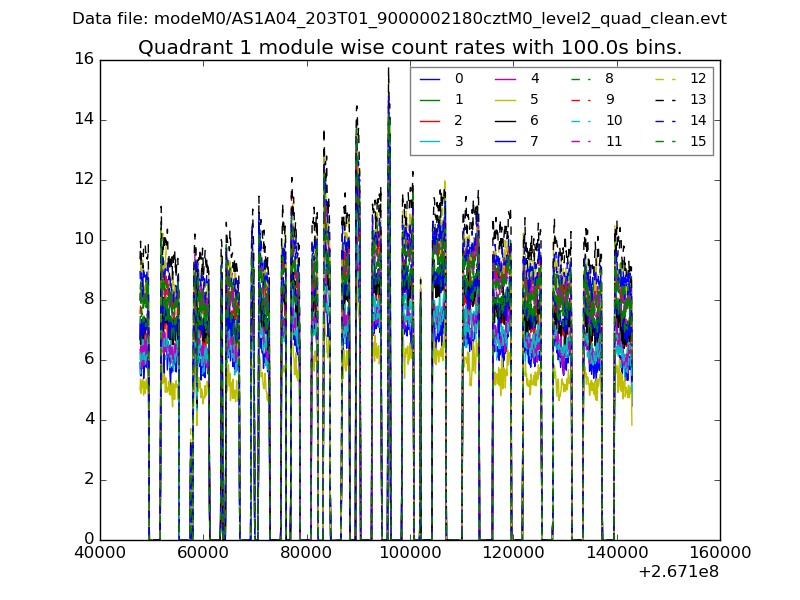 |
 |
| Module-wise count rates for Quadrant C Data is divided into 100 sec bins |
 |
 |
| Module-wise count rates for Quadrant D Data is divided into 100 sec bins |
 |
 |
| Parameter | Plot |
|---|---|
| CZT HV Monitor |  |
| D_VDD |  |
| Temperature 1 | 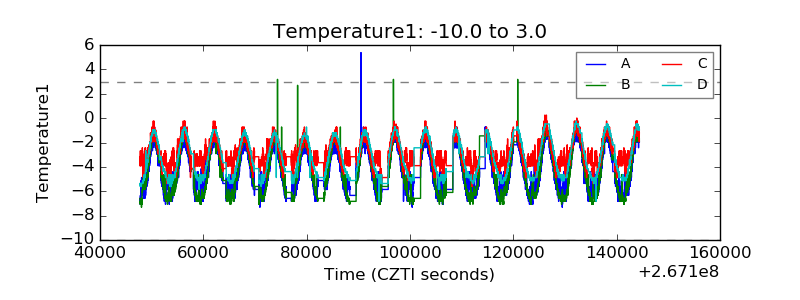 |
| Veto HV Monitor |  |
| Veto LLD |  |
| Alpha Counter | 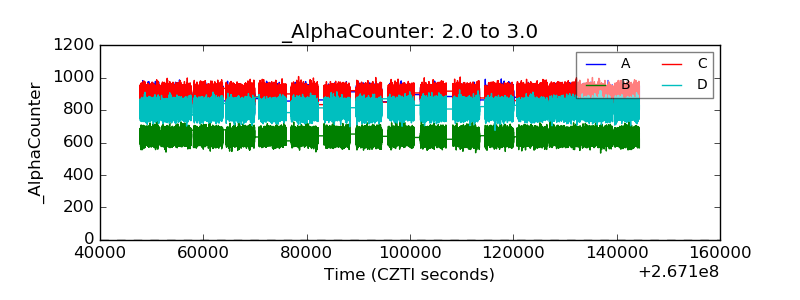 |
| _CPM_Rate |  |
| CZT Counter | 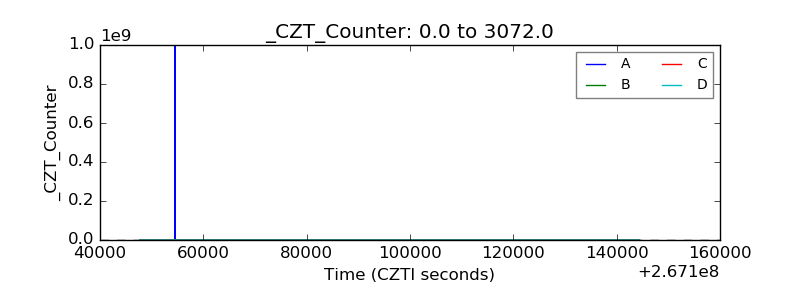 |
| +2.5 Volts monitor |  |
| +5 Volts monitor |  |
| _ROLL_ROT |  |
| _Roll_DEC |  |
| _Roll_RA |  |
| Veto Counter | 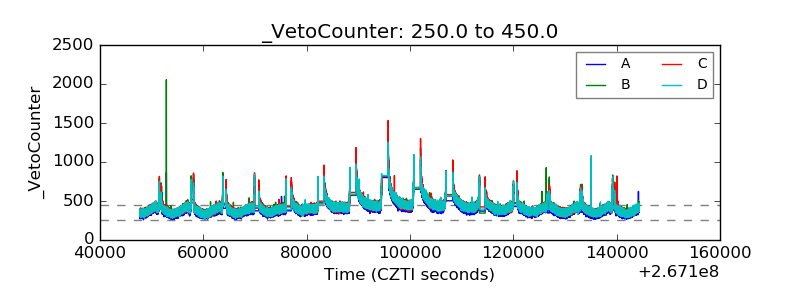 |