| Param | Original file | Final file |
|---|---|---|
| Filename | modeM0/AS1A04_048T01_9000002176cztM0_level2_bc.evt | modeM0/AS1A04_048T01_9000002176cztM0_level2_quad_clean.evt |
| Size (bytes) | 2,679,932,160 | 1,089,838,080 |
| Size | 2.5 GB | 1.0 GB |
| Events in quadrant A | 17,826,472 | 7,138,291 |
| Events in quadrant B | 17,237,995 | 7,047,137 |
| Events in quadrant C | 22,039,091 | 6,865,859 |
| Events in quadrant D | 18,941,549 | 6,811,184 |
| Mode M9 | |||
|---|---|---|---|
| Quadrant | BADHDUFLAG | Total packets | Discarded packets |
| A | 0 | 117 | 0 |
| B | 0 | 117 | 0 |
| C | 0 | 117 | 0 |
| D | 0 | 117 | 0 |
| Mode M0 | |||
|---|---|---|---|
| Quadrant | BADHDUFLAG | Total packets | Discarded packets |
| A | 0 | 161390 | 0 |
| B | 0 | 160808 | 0 |
| C | 0 | 175612 | 0 |
| D | 0 | 166715 | 0 |
| Mode SS | |||
|---|---|---|---|
| Quadrant | BADHDUFLAG | Total packets | Discarded packets |
| A | 0 | 1526 | 0 |
| B | 0 | 1526 | 0 |
| C | 0 | 1526 | 0 |
| D | 0 | 1526 | 0 |
| Quadrant | Total seconds | Saturated seconds | Saturation percentage |
|---|---|---|---|
| A | 75124 | 781 | 1.039615% |
| B | 75124 | 867 | 1.154092% |
| C | 75124 | 790 | 1.051595% |
| D | 75124 | 1309 | 1.742452% |
Noise dominated data is calculated using 1-second bins in cleaned event files. If a bin has >2000 counts, and if more than 50% of those come from <1% of pixels, then it is considered to be noise-dominated and hence unusable.
| Quadrant | # 1 sec bins | Bins with >0 counts | Bins with >2000 counts | High rate bins dominated by noise | Noise dominated (total time) | Noise dominated (detector-on time) | Marked lightcurve |
|---|---|---|---|---|---|---|---|
| A | 86664 | 75117 | 10 | 10 | 0.01% | 0.01% | 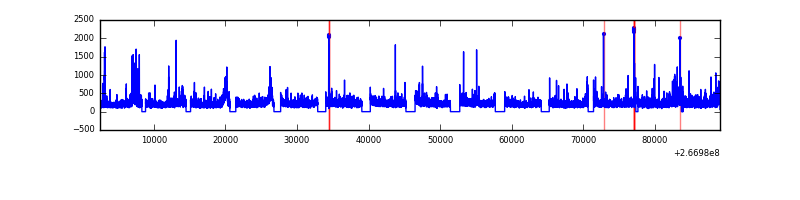 |
| B | 86664 | 75118 | 7 | 7 | 0.01% | 0.01% | 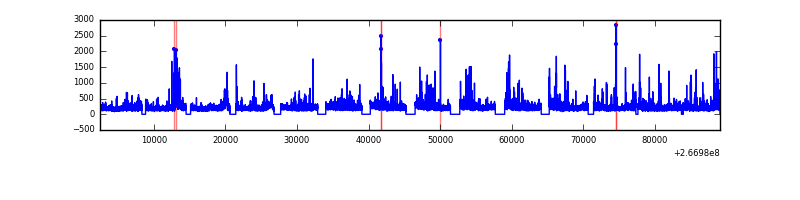 |
| C | 86664 | 75118 | 60 | 60 | 0.07% | 0.08% |  |
| D | 86664 | 75117 | 326 | 326 | 0.38% | 0.43% |  |
Top three noisy pixels from each quadrant. If the there are fewer than three noisy pixels in the level2.evt file, extra rows are filled as -1
| Pixel properties | Quadrant properties | ||||||
|---|---|---|---|---|---|---|---|
| Quadrant | DetID | PixID | Counts | Sigma | Mean | Median | Sigma |
| A | 8 | 15 | 793611 | 854.62 | 4114 | 4044 | 923.9 |
| A | 12 | 189 | 770440 | 829.54 | 4114 | 4044 | 923.9 |
| A | 9 | 143 | 144175 | 151.68 | 4114 | 4044 | 923.9 |
| B | 0 | 205 | 309400 | 392.48 | 4028 | 3917 | 778.3 |
| B | 0 | 85 | 276335 | 349.99 | 4028 | 3917 | 778.3 |
| B | 4 | 142 | 174654 | 219.36 | 4028 | 3917 | 778.3 |
| C | 3 | 233 | 5489432 | 6282.12 | 3900 | 3862 | 873.2 |
| C | 0 | 207 | 715033 | 814.44 | 3900 | 3862 | 873.2 |
| C | 4 | 254 | 388902 | 440.95 | 3900 | 3862 | 873.2 |
| D | 1 | 255 | 1088033 | 1088.65 | 4012 | 3906 | 995.8 |
| D | 15 | 0 | 512455 | 510.67 | 4012 | 3906 | 995.8 |
| D | 12 | 16 | 482382 | 480.47 | 4012 | 3906 | 995.8 |
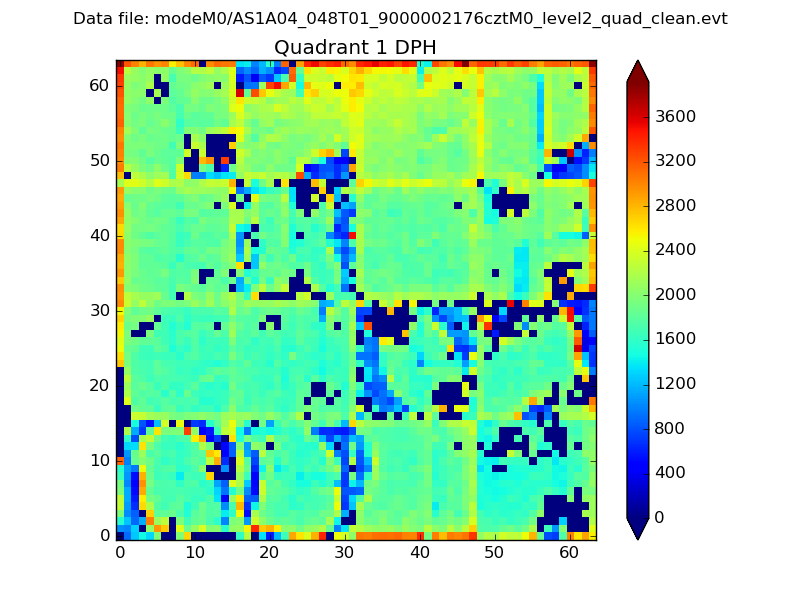
Histogram calculated using DETX and DETY for each event in the final _common_clean file
| Quadrant A |  |
 |
Quadrant B |
|---|---|---|---|
| Quadrant D |  |
 |
Quadrant C |
| Plot type | Count rate plots | Images |
|---|---|---|
| Comparison with Poisson distribution Blue bars denote a histogram of data divided into 1 sec bins. Red curve is a Poisson curve with rate = median count rate of data. |
 |
 |
| Quadrant-wise count rates Data is divided into 100 sec bins |
 |
|
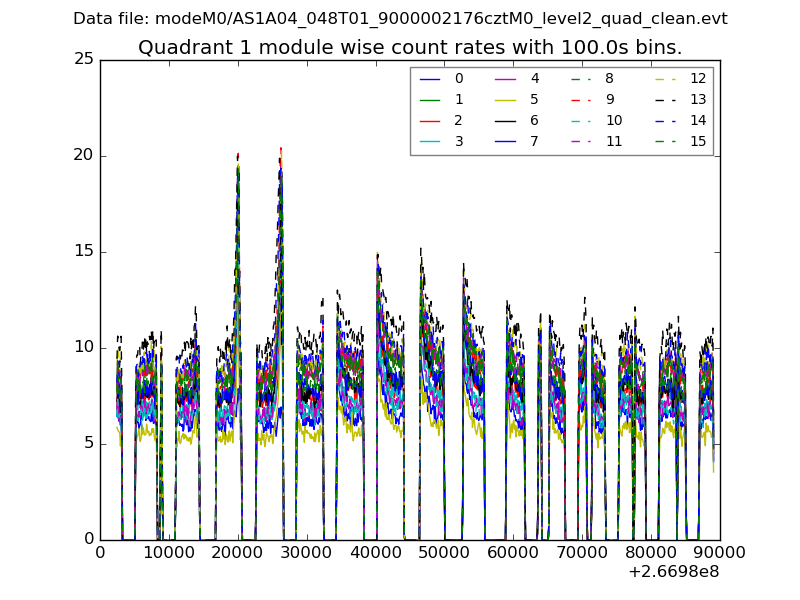
| Module-wise count rates for Quadrant A Data is divided into 100 sec bins |
 |
 |
| Module-wise count rates for Quadrant B Data is divided into 100 sec bins |
 |
 |
| Module-wise count rates for Quadrant C Data is divided into 100 sec bins |
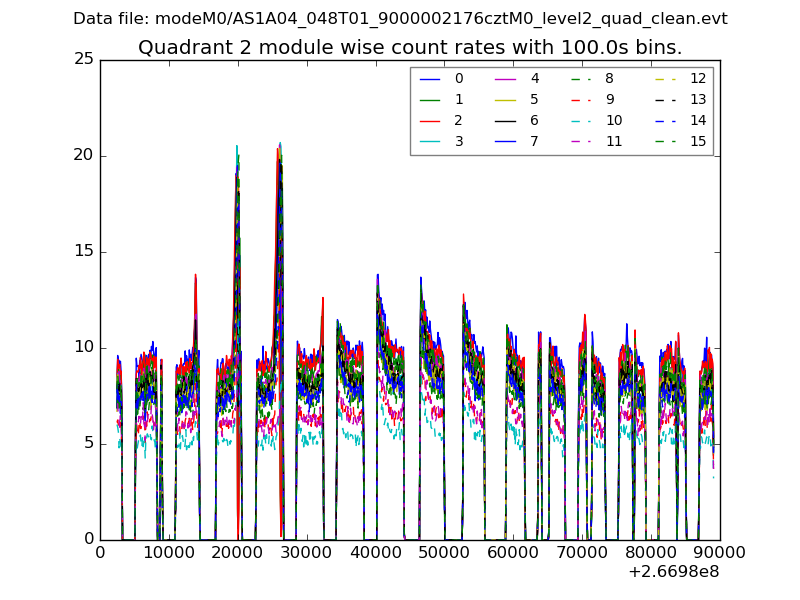 |
 |
| Module-wise count rates for Quadrant D Data is divided into 100 sec bins |
 |
 |
| Parameter | Plot |
|---|---|
| CZT HV Monitor |  |
| D_VDD |  |
| Temperature 1 |  |
| Veto HV Monitor | 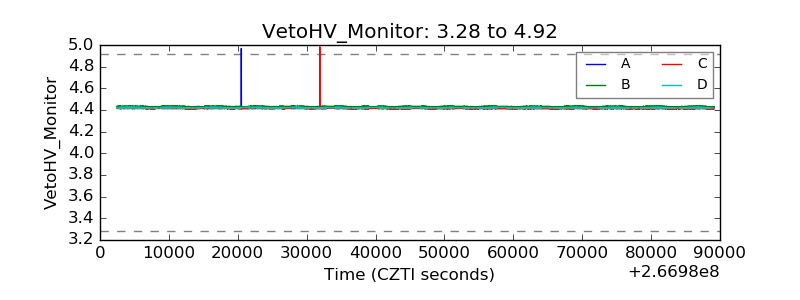 |
| Veto LLD |  |
| Alpha Counter |  |
| _CPM_Rate |  |
| CZT Counter |  |
| +2.5 Volts monitor |  |
| +5 Volts monitor |  |
| _ROLL_ROT | 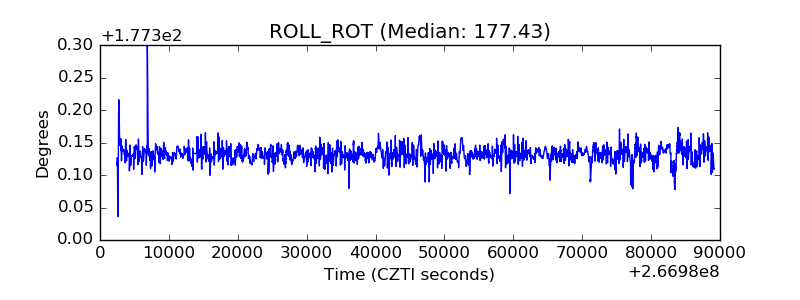 |
| _Roll_DEC |  |
| _Roll_RA |  |
| Veto Counter |  |