| Param | Original file | Final file |
|---|---|---|
| Filename | modeM0/AS1G08_057T09_9000002174cztM0_level2_bc.evt | modeM0/AS1G08_057T09_9000002174cztM0_level2_quad_clean.evt |
| Size (bytes) | 2,627,873,280 | 1,020,625,920 |
| Size | 2.4 GB | 973.3 MB |
| Events in quadrant A | 16,354,948 | 6,606,189 |
| Events in quadrant B | 16,512,665 | 6,486,984 |
| Events in quadrant C | 25,755,360 | 6,404,494 |
| Events in quadrant D | 15,988,481 | 6,411,264 |
| Mode M0 | |||
|---|---|---|---|
| Quadrant | BADHDUFLAG | Total packets | Discarded packets |
| A | 0 | 153640 | 0 |
| B | 0 | 156120 | 0 |
| C | 0 | 195415 | 0 |
| D | 0 | 152810 | 0 |
| Mode M9 | |||
|---|---|---|---|
| Quadrant | BADHDUFLAG | Total packets | Discarded packets |
| A | 0 | 118 | 0 |
| B | 0 | 118 | 0 |
| C | 0 | 118 | 0 |
| D | 0 | 118 | 0 |
| Mode SS | |||
|---|---|---|---|
| Quadrant | BADHDUFLAG | Total packets | Discarded packets |
| A | 0 | 1488 | 0 |
| B | 0 | 1488 | 0 |
| C | 0 | 1488 | 0 |
| D | 0 | 1488 | 0 |
| Quadrant | Total seconds | Saturated seconds | Saturation percentage |
|---|---|---|---|
| A | 73027 | 702 | 0.961288% |
| B | 73027 | 1183 | 1.619949% |
| C | 73027 | 803 | 1.099593% |
| D | 73027 | 545 | 0.746299% |
Noise dominated data is calculated using 1-second bins in cleaned event files. If a bin has >2000 counts, and if more than 50% of those come from <1% of pixels, then it is considered to be noise-dominated and hence unusable.
| Quadrant | # 1 sec bins | Bins with >0 counts | Bins with >2000 counts | High rate bins dominated by noise | Noise dominated (total time) | Noise dominated (detector-on time) | Marked lightcurve |
|---|---|---|---|---|---|---|---|
| A | 84773 | 73022 | 1 | 1 | 0.00% | 0.00% |  |
| B | 84773 | 73019 | 193 | 193 | 0.23% | 0.26% | 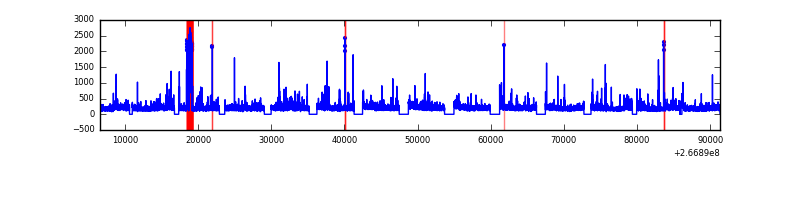 |
| C | 84773 | 73022 | 1 | 1 | 0.00% | 0.00% |  |
| D | 84773 | 73023 | 10 | 10 | 0.01% | 0.01% |  |
Top three noisy pixels from each quadrant. If the there are fewer than three noisy pixels in the level2.evt file, extra rows are filled as -1
| Pixel properties | Quadrant properties | ||||||
|---|---|---|---|---|---|---|---|
| Quadrant | DetID | PixID | Counts | Sigma | Mean | Median | Sigma |
| A | 12 | 189 | 569781 | 680.44 | 3876 | 3805 | 831.8 |
| A | 8 | 15 | 493229 | 588.4 | 3876 | 3805 | 831.8 |
| A | 9 | 143 | 125876 | 146.76 | 3876 | 3805 | 831.8 |
| B | 10 | 16 | 903796 | 1259.99 | 3832 | 3741 | 714.3 |
| B | 0 | 214 | 200311 | 275.18 | 3832 | 3741 | 714.3 |
| B | 0 | 205 | 159272 | 217.73 | 3832 | 3741 | 714.3 |
| C | 3 | 233 | 10886842 | 13100.26 | 3760 | 3713 | 830.8 |
| C | 3 | 234 | 81381 | 93.49 | 3760 | 3713 | 830.8 |
| C | 14 | 234 | 31818 | 33.83 | 3760 | 3713 | 830.8 |
| D | 12 | 110 | 405573 | 449.81 | 3828 | 3727 | 893.4 |
| D | 2 | 234 | 270234 | 298.32 | 3828 | 3727 | 893.4 |
| D | 2 | 120 | 165589 | 181.18 | 3828 | 3727 | 893.4 |
Histogram calculated using DETX and DETY for each event in the final _common_clean file
| Quadrant A |  |
 |
Quadrant B |
|---|---|---|---|
| Quadrant D | 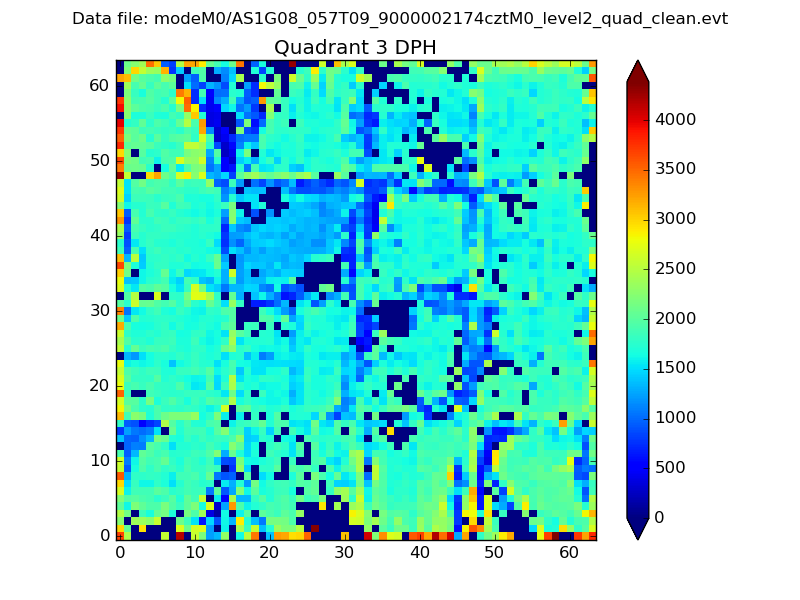 |
 |
Quadrant C |
| Plot type | Count rate plots | Images |
|---|---|---|
| Comparison with Poisson distribution Blue bars denote a histogram of data divided into 1 sec bins. Red curve is a Poisson curve with rate = median count rate of data. |
 |
 |
| Quadrant-wise count rates Data is divided into 100 sec bins |
 |
|
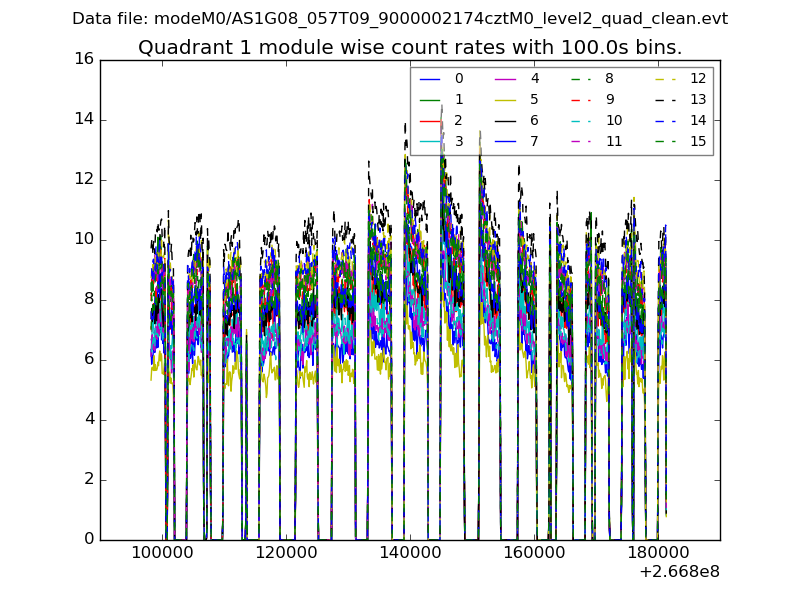
| Module-wise count rates for Quadrant A Data is divided into 100 sec bins |
 |
 |
| Module-wise count rates for Quadrant B Data is divided into 100 sec bins |
 |
 |
| Module-wise count rates for Quadrant C Data is divided into 100 sec bins |
 |
 |
| Module-wise count rates for Quadrant D Data is divided into 100 sec bins |
 |
 |
| Parameter | Plot |
|---|---|
| CZT HV Monitor |  |
| D_VDD |  |
| Temperature 1 | 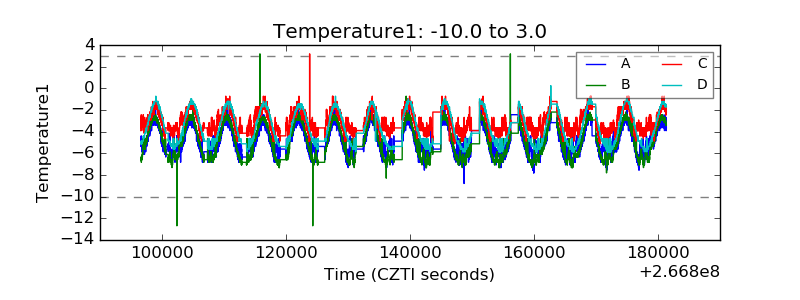 |
| Veto HV Monitor |  |
| Veto LLD |  |
| Alpha Counter |  |
| _CPM_Rate |  |
| CZT Counter |  |
| +2.5 Volts monitor |  |
| +5 Volts monitor |  |
| _ROLL_ROT | 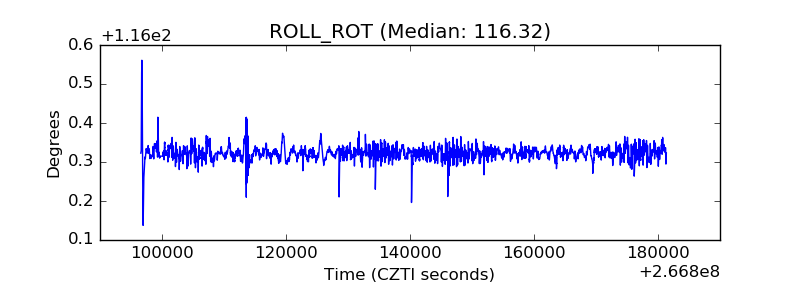 |
| _Roll_DEC | 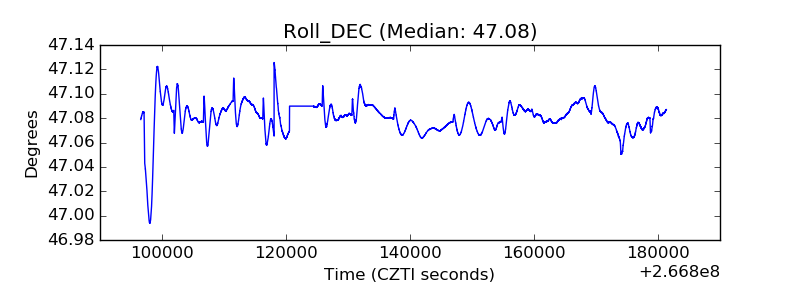 |
| _Roll_RA | 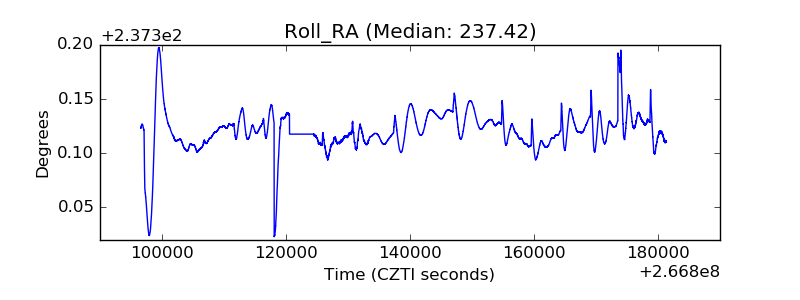 |
| Veto Counter |  |