| Param | Original file | Final file |
|---|---|---|
| Filename | modeM0/AS1A04_011T07_9000002172cztM0_level2_bc.evt | modeM0/AS1A04_011T07_9000002172cztM0_level2_quad_clean.evt |
| Size (bytes) | 1,871,867,520 | 712,857,600 |
| Size | 1.7 GB | 679.8 MB |
| Events in quadrant A | 12,413,327 | 4,662,138 |
| Events in quadrant B | 11,828,154 | 4,582,766 |
| Events in quadrant C | 16,157,284 | 4,493,669 |
| Events in quadrant D | 12,927,518 | 4,467,767 |
| Mode SS | |||
|---|---|---|---|
| Quadrant | BADHDUFLAG | Total packets | Discarded packets |
| A | 0 | 1008 | 0 |
| B | 0 | 1008 | 0 |
| C | 0 | 1008 | 0 |
| D | 0 | 1008 | 0 |
| Mode M9 | |||
|---|---|---|---|
| Quadrant | BADHDUFLAG | Total packets | Discarded packets |
| A | 0 | 97 | 0 |
| B | 0 | 97 | 0 |
| C | 0 | 97 | 0 |
| D | 0 | 97 | 0 |
| Mode M0 | |||
|---|---|---|---|
| Quadrant | BADHDUFLAG | Total packets | Discarded packets |
| A | 0 | 108830 | 0 |
| B | 0 | 108688 | 0 |
| C | 0 | 125112 | 0 |
| D | 0 | 110546 | 0 |
| Quadrant | Total seconds | Saturated seconds | Saturation percentage |
|---|---|---|---|
| A | 49352 | 606 | 1.227914% |
| B | 49352 | 878 | 1.779057% |
| C | 49352 | 613 | 1.242098% |
| D | 49352 | 786 | 1.592641% |
Noise dominated data is calculated using 1-second bins in cleaned event files. If a bin has >2000 counts, and if more than 50% of those come from <1% of pixels, then it is considered to be noise-dominated and hence unusable.
| Quadrant | # 1 sec bins | Bins with >0 counts | Bins with >2000 counts | High rate bins dominated by noise | Noise dominated (total time) | Noise dominated (detector-on time) | Marked lightcurve |
|---|---|---|---|---|---|---|---|
| A | 59089 | 49347 | 1 | 1 | 0.00% | 0.00% | 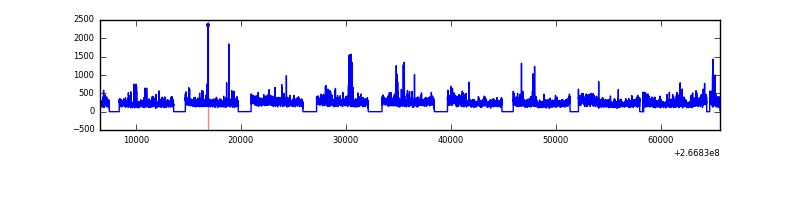 |
| B | 59089 | 49345 | 34 | 34 | 0.06% | 0.07% |  |
| C | 59089 | 49346 | 9 | 9 | 0.02% | 0.02% |  |
| D | 59089 | 49347 | 91 | 91 | 0.15% | 0.18% |  |
Top three noisy pixels from each quadrant. If the there are fewer than three noisy pixels in the level2.evt file, extra rows are filled as -1
| Pixel properties | Quadrant properties | ||||||
|---|---|---|---|---|---|---|---|
| Quadrant | DetID | PixID | Counts | Sigma | Mean | Median | Sigma |
| A | 8 | 15 | 1107635 | 1867.11 | 2740 | 2686 | 591.8 |
| A | 12 | 189 | 427691 | 718.16 | 2740 | 2686 | 591.8 |
| A | 3 | 1 | 168255 | 279.77 | 2740 | 2686 | 591.8 |
| B | 10 | 16 | 687176 | 1347.35 | 2696 | 2629 | 508.1 |
| B | 0 | 229 | 214385 | 416.78 | 2696 | 2629 | 508.1 |
| B | 0 | 205 | 136430 | 263.35 | 2696 | 2629 | 508.1 |
| C | 3 | 233 | 5595081 | 9816.25 | 2611 | 2578 | 569.7 |
| C | 0 | 207 | 274481 | 477.26 | 2611 | 2578 | 569.7 |
| C | 3 | 234 | 38513 | 63.07 | 2611 | 2578 | 569.7 |
| D | 12 | 110 | 1524865 | 2305.95 | 2660 | 2591 | 660.2 |
| D | 9 | 1 | 239658 | 359.11 | 2660 | 2591 | 660.2 |
| D | 2 | 234 | 230656 | 345.47 | 2660 | 2591 | 660.2 |
Histogram calculated using DETX and DETY for each event in the final _common_clean file
| Quadrant A |  |
 |
Quadrant B |
|---|---|---|---|
| Quadrant D | 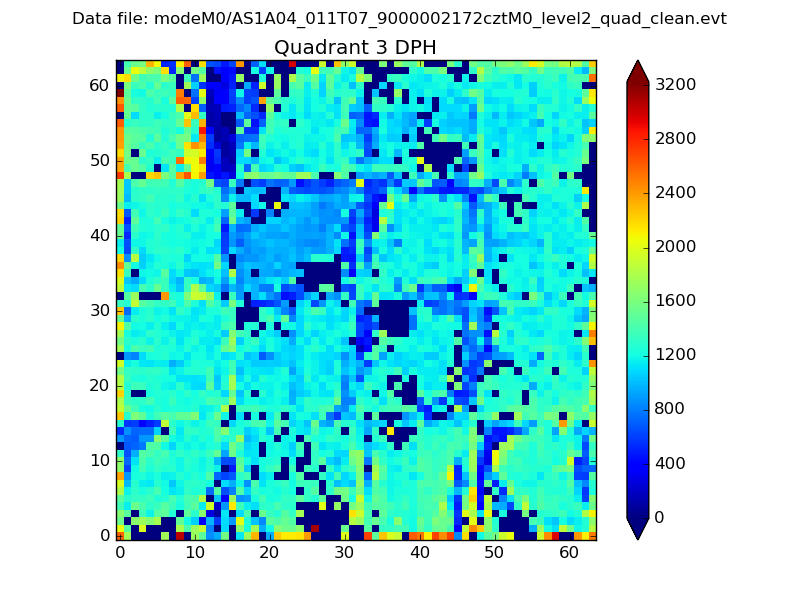 |
 |
Quadrant C |
| Plot type | Count rate plots | Images |
|---|---|---|
| Comparison with Poisson distribution Blue bars denote a histogram of data divided into 1 sec bins. Red curve is a Poisson curve with rate = median count rate of data. |
 |
 |
| Quadrant-wise count rates Data is divided into 100 sec bins |
 |
|
| Module-wise count rates for Quadrant A Data is divided into 100 sec bins |
 |
 |
| Module-wise count rates for Quadrant B Data is divided into 100 sec bins |
 |
 |
| Module-wise count rates for Quadrant C Data is divided into 100 sec bins |
 |
 |
| Module-wise count rates for Quadrant D Data is divided into 100 sec bins |
 |
 |
| Parameter | Plot |
|---|---|
| CZT HV Monitor |  |
| D_VDD |  |
| Temperature 1 |  |
| Veto HV Monitor |  |
| Veto LLD |  |
| Alpha Counter |  |
| _CPM_Rate |  |
| CZT Counter |  |
| +2.5 Volts monitor |  |
| +5 Volts monitor | 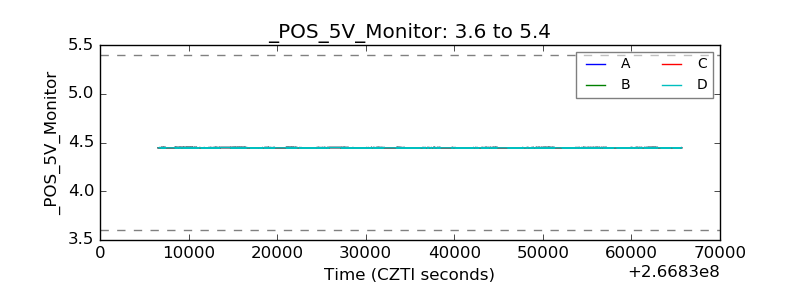 |
| _ROLL_ROT |  |
| _Roll_DEC |  |
| _Roll_RA |  |
| Veto Counter |  |