| Param | Original file | Final file |
|---|---|---|
| Filename | modeM0/AS1A04_101T01_9000002170cztM0_level2_bc.evt | modeM0/AS1A04_101T01_9000002170cztM0_level2_quad_clean.evt |
| Size (bytes) | 3,680,265,600 | 1,318,564,800 |
| Size | 3.4 GB | 1.2 GB |
| Events in quadrant A | 27,253,851 | 8,425,819 |
| Events in quadrant B | 23,127,955 | 8,262,027 |
| Events in quadrant C | 28,668,443 | 8,302,367 |
| Events in quadrant D | 25,681,055 | 8,177,968 |
| Mode M0 | |||
|---|---|---|---|
| Quadrant | BADHDUFLAG | Total packets | Discarded packets |
| A | 0 | 225393 | 0 |
| B | 0 | 218319 | 0 |
| C | 0 | 231722 | 0 |
| D | 0 | 221275 | 0 |
| Mode M9 | |||
|---|---|---|---|
| Quadrant | BADHDUFLAG | Total packets | Discarded packets |
| A | 0 | 143 | 0 |
| B | 0 | 143 | 0 |
| C | 0 | 143 | 0 |
| D | 0 | 143 | 0 |
| Mode SS | |||
|---|---|---|---|
| Quadrant | BADHDUFLAG | Total packets | Discarded packets |
| A | 0 | 2014 | 0 |
| B | 0 | 2014 | 0 |
| C | 0 | 2014 | 0 |
| D | 0 | 2014 | 0 |
| Quadrant | Total seconds | Saturated seconds | Saturation percentage |
|---|---|---|---|
| A | 98799 | 1094 | 1.107299% |
| B | 98799 | 2219 | 2.245974% |
| C | 98799 | 801 | 0.810737% |
| D | 98799 | 1557 | 1.575927% |
Noise dominated data is calculated using 1-second bins in cleaned event files. If a bin has >2000 counts, and if more than 50% of those come from <1% of pixels, then it is considered to be noise-dominated and hence unusable.
| Quadrant | # 1 sec bins | Bins with >0 counts | Bins with >2000 counts | High rate bins dominated by noise | Noise dominated (total time) | Noise dominated (detector-on time) | Marked lightcurve |
|---|---|---|---|---|---|---|---|
| A | 113150 | 98791 | 3 | 3 | 0.00% | 0.00% |  |
| B | 113150 | 98782 | 86 | 86 | 0.08% | 0.09% |  |
| C | 113150 | 98787 | 7 | 7 | 0.01% | 0.01% |  |
| D | 113150 | 98790 | 223 | 223 | 0.20% | 0.23% |  |
Top three noisy pixels from each quadrant. If the there are fewer than three noisy pixels in the level2.evt file, extra rows are filled as -1
| Pixel properties | Quadrant properties | ||||||
|---|---|---|---|---|---|---|---|
| Quadrant | DetID | PixID | Counts | Sigma | Mean | Median | Sigma |
| A | 8 | 15 | 5462217 | 4827.24 | 5207 | 5109 | 1130.5 |
| A | 0 | 253 | 1067008 | 939.33 | 5207 | 5109 | 1130.5 |
| A | 12 | 189 | 429584 | 375.48 | 5207 | 5109 | 1130.5 |
| B | 10 | 16 | 1984204 | 2054.28 | 5132 | 4994 | 963.5 |
| B | 0 | 219 | 305292 | 311.69 | 5132 | 4994 | 963.5 |
| B | 0 | 205 | 294986 | 300.99 | 5132 | 4994 | 963.5 |
| C | 3 | 233 | 8695613 | 7807.29 | 5056 | 4983 | 1113.1 |
| C | 0 | 207 | 73766 | 61.79 | 5056 | 4983 | 1113.1 |
| C | 3 | 234 | 39060 | 30.61 | 5056 | 4983 | 1113.1 |
| D | 12 | 110 | 2431396 | 1901.23 | 5100 | 4955 | 1276.2 |
| D | 10 | 199 | 886649 | 690.85 | 5100 | 4955 | 1276.2 |
| D | 5 | 222 | 559220 | 434.29 | 5100 | 4955 | 1276.2 |
Histogram calculated using DETX and DETY for each event in the final _common_clean file
| Quadrant A |  |
 |
Quadrant B |
|---|---|---|---|
| Quadrant D |  |
 |
Quadrant C |
| Plot type | Count rate plots | Images |
|---|---|---|
| Comparison with Poisson distribution Blue bars denote a histogram of data divided into 1 sec bins. Red curve is a Poisson curve with rate = median count rate of data. |
 |
 |
| Quadrant-wise count rates Data is divided into 100 sec bins |
 |
|
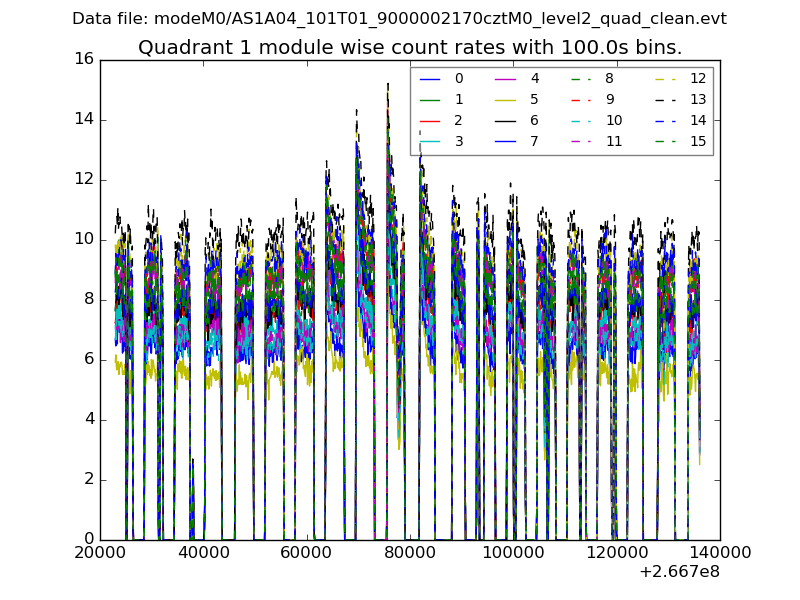
| Module-wise count rates for Quadrant A Data is divided into 100 sec bins |
 |
 |
| Module-wise count rates for Quadrant B Data is divided into 100 sec bins |
 |
 |
| Module-wise count rates for Quadrant C Data is divided into 100 sec bins |
 |
 |
| Module-wise count rates for Quadrant D Data is divided into 100 sec bins |
 |
 |
| Parameter | Plot |
|---|---|
| CZT HV Monitor |  |
| D_VDD | 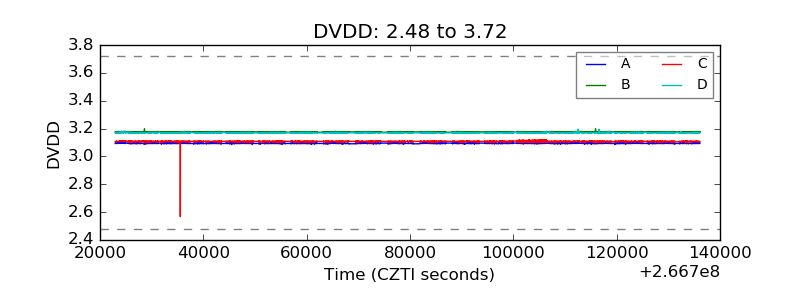 |
| Temperature 1 |  |
| Veto HV Monitor |  |
| Veto LLD |  |
| Alpha Counter |  |
| _CPM_Rate |  |
| CZT Counter |  |
| +2.5 Volts monitor |  |
| +5 Volts monitor |  |
| _ROLL_ROT |  |
| _Roll_DEC | 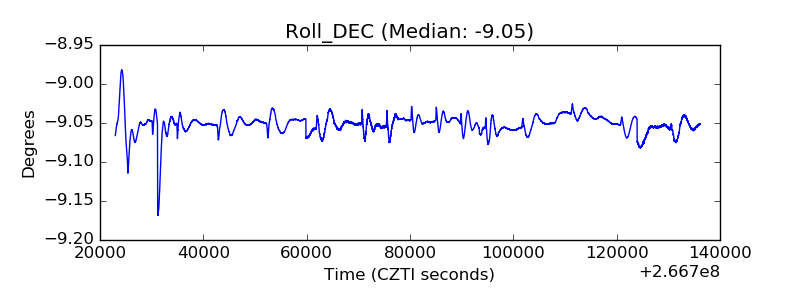 |
| _Roll_RA |  |
| Veto Counter |  |