| Param | Original file | Final file |
|---|---|---|
| Filename | modeM0/AS1G08_020T01_9000002168cztM0_level2_bc.evt | modeM0/AS1G08_020T01_9000002168cztM0_level2_quad_clean.evt |
| Size (bytes) | 1,476,486,720 | 601,076,160 |
| Size | 1.4 GB | 573.2 MB |
| Events in quadrant A | 9,489,918 | 3,916,566 |
| Events in quadrant B | 9,377,923 | 3,901,179 |
| Events in quadrant C | 12,649,429 | 3,821,063 |
| Events in quadrant D | 10,450,885 | 3,802,362 |
| Mode M9 | |||
|---|---|---|---|
| Quadrant | BADHDUFLAG | Total packets | Discarded packets |
| A | 0 | 86 | 0 |
| B | 0 | 86 | 0 |
| C | 0 | 86 | 0 |
| D | 0 | 86 | 0 |
| Mode M0 | |||
|---|---|---|---|
| Quadrant | BADHDUFLAG | Total packets | Discarded packets |
| A | 0 | 87292 | 0 |
| B | 0 | 87792 | 0 |
| C | 0 | 100709 | 0 |
| D | 0 | 90608 | 0 |
| Mode SS | |||
|---|---|---|---|
| Quadrant | BADHDUFLAG | Total packets | Discarded packets |
| A | 0 | 820 | 0 |
| B | 0 | 820 | 0 |
| C | 0 | 820 | 0 |
| D | 0 | 820 | 0 |
| Quadrant | Total seconds | Saturated seconds | Saturation percentage |
|---|---|---|---|
| A | 40288 | 442 | 1.097101% |
| B | 40288 | 590 | 1.464456% |
| C | 40288 | 469 | 1.164118% |
| D | 40288 | 852 | 2.114774% |
Noise dominated data is calculated using 1-second bins in cleaned event files. If a bin has >2000 counts, and if more than 50% of those come from <1% of pixels, then it is considered to be noise-dominated and hence unusable.
| Quadrant | # 1 sec bins | Bins with >0 counts | Bins with >2000 counts | High rate bins dominated by noise | Noise dominated (total time) | Noise dominated (detector-on time) | Marked lightcurve |
|---|---|---|---|---|---|---|---|
| A | 48799 | 40286 | 0 | 0 | 0.00% | 0.00% |  |
| B | 48799 | 40283 | 6 | 6 | 0.01% | 0.01% |  |
| C | 48799 | 40285 | 0 | 0 | 0.00% | 0.00% |  |
| D | 48799 | 40286 | 86 | 86 | 0.18% | 0.21% |  |
Top three noisy pixels from each quadrant. If the there are fewer than three noisy pixels in the level2.evt file, extra rows are filled as -1
| Pixel properties | Quadrant properties | ||||||
|---|---|---|---|---|---|---|---|
| Quadrant | DetID | PixID | Counts | Sigma | Mean | Median | Sigma |
| A | 8 | 15 | 297314 | 607.33 | 2247 | 2208 | 485.9 |
| A | 1 | 162 | 212409 | 432.59 | 2247 | 2208 | 485.9 |
| A | 12 | 189 | 134929 | 273.14 | 2247 | 2208 | 485.9 |
| B | 10 | 246 | 134655 | 319.01 | 2250 | 2196 | 415.2 |
| B | 0 | 214 | 101586 | 239.37 | 2250 | 2196 | 415.2 |
| B | 0 | 205 | 82540 | 193.5 | 2250 | 2196 | 415.2 |
| C | 3 | 233 | 4038416 | 8503.87 | 2191 | 2171 | 474.6 |
| C | 3 | 234 | 23073 | 44.04 | 2191 | 2171 | 474.6 |
| C | 0 | 207 | 14462 | 25.9 | 2191 | 2171 | 474.6 |
| D | 10 | 199 | 865358 | 1679.92 | 2216 | 2151 | 513.8 |
| D | 5 | 222 | 438233 | 848.68 | 2216 | 2151 | 513.8 |
| D | 10 | 70 | 164212 | 315.39 | 2216 | 2151 | 513.8 |
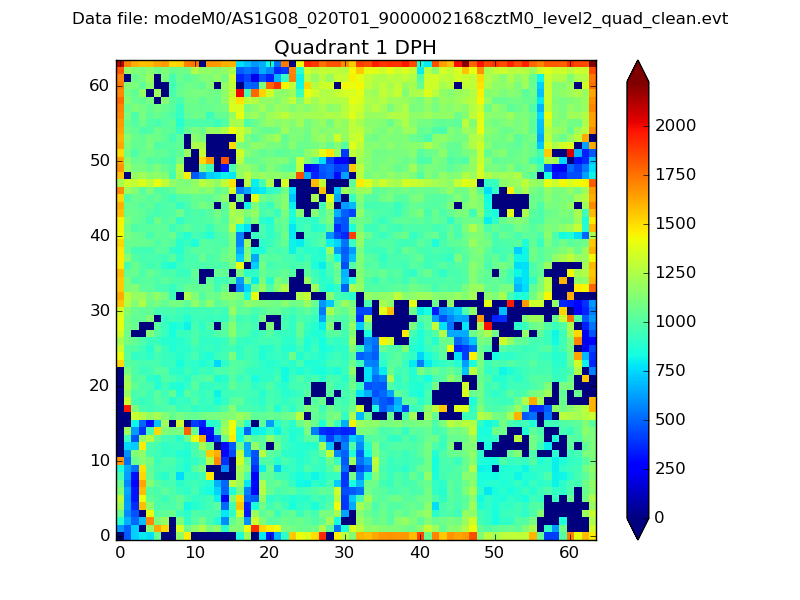
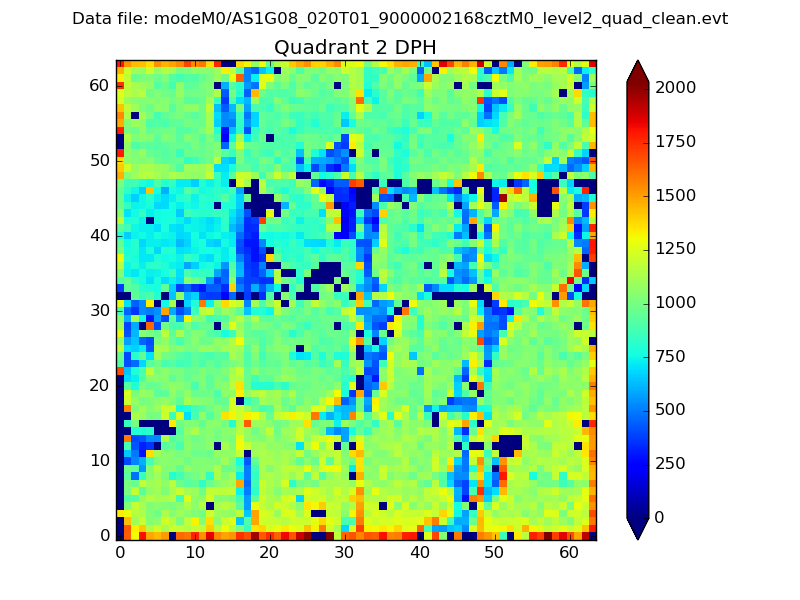
Histogram calculated using DETX and DETY for each event in the final _common_clean file
| Quadrant A |  |
 |
Quadrant B |
|---|---|---|---|
| Quadrant D | 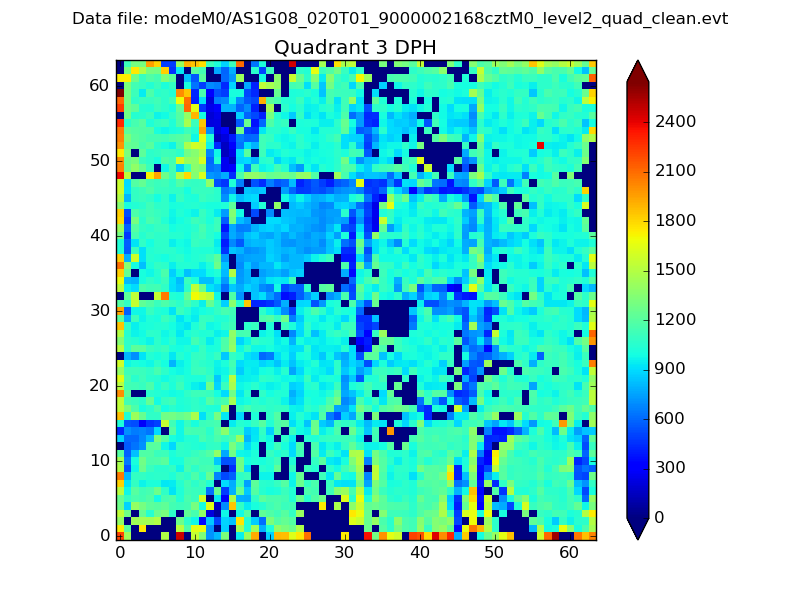 |
 |
Quadrant C |
| Plot type | Count rate plots | Images |
|---|---|---|
| Comparison with Poisson distribution Blue bars denote a histogram of data divided into 1 sec bins. Red curve is a Poisson curve with rate = median count rate of data. |
 |
 |
| Quadrant-wise count rates Data is divided into 100 sec bins |
 |
|
| Module-wise count rates for Quadrant A Data is divided into 100 sec bins |
 |
 |
| Module-wise count rates for Quadrant B Data is divided into 100 sec bins |
 |
 |
| Module-wise count rates for Quadrant C Data is divided into 100 sec bins |
 |
 |
| Module-wise count rates for Quadrant D Data is divided into 100 sec bins |
 |
 |
| Parameter | Plot |
|---|---|
| CZT HV Monitor |  |
| D_VDD | 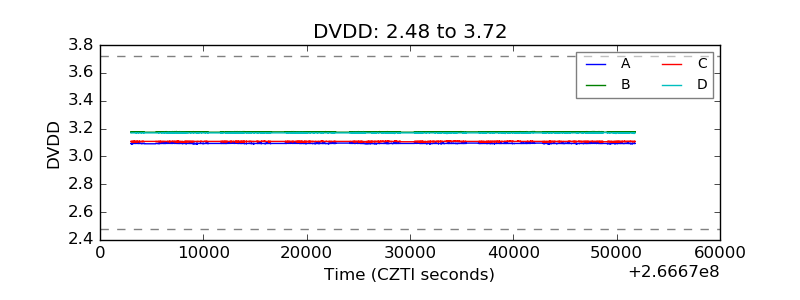 |
| Temperature 1 |  |
| Veto HV Monitor | 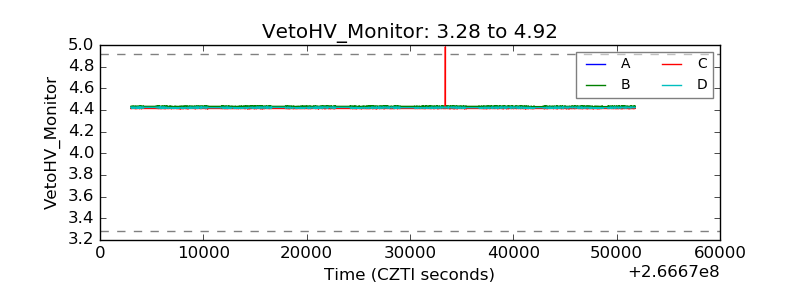 |
| Veto LLD |  |
| Alpha Counter |  |
| _CPM_Rate | 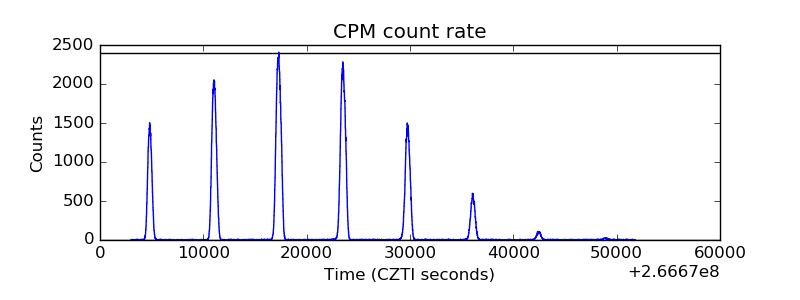 |
| CZT Counter |  |
| +2.5 Volts monitor | 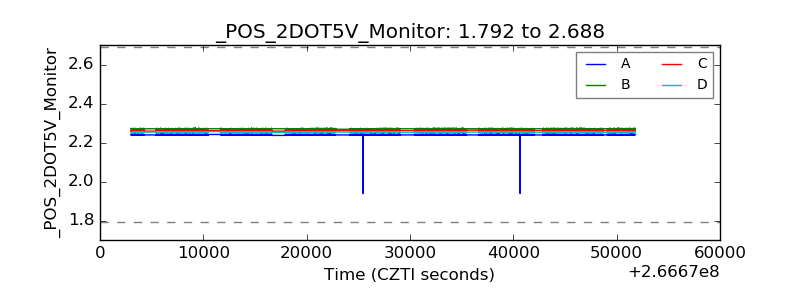 |
| +5 Volts monitor |  |
| _ROLL_ROT |  |
| _Roll_DEC |  |
| _Roll_RA | 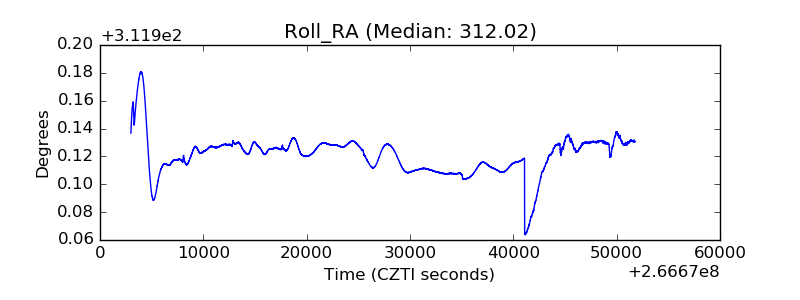 |
| Veto Counter |  |