| Param | Original file | Final file |
|---|---|---|
| Filename | modeM0/AS1G08_019T01_9000002166cztM0_level2_bc.evt | modeM0/AS1G08_019T01_9000002166cztM0_level2_quad_clean.evt |
| Size (bytes) | 1,099,267,200 | 301,000,320 |
| Size | 1.0 GB | 287.1 MB |
| Events in quadrant A | 9,833,423 | 1,860,819 |
| Events in quadrant B | 5,407,008 | 1,869,663 |
| Events in quadrant C | 9,710,822 | 1,806,773 |
| Events in quadrant D | 6,594,191 | 1,818,427 |
| Mode M0 | |||
|---|---|---|---|
| Quadrant | BADHDUFLAG | Total packets | Discarded packets |
| A | 0 | 66833 | 0 |
| B | 0 | 53260 | 0 |
| C | 0 | 70775 | 0 |
| D | 0 | 57004 | 0 |
| Mode SS | |||
|---|---|---|---|
| Quadrant | BADHDUFLAG | Total packets | Discarded packets |
| A | 0 | 518 | 0 |
| B | 0 | 518 | 0 |
| C | 0 | 518 | 0 |
| D | 0 | 518 | 0 |
| Mode M9 | |||
|---|---|---|---|
| Quadrant | BADHDUFLAG | Total packets | Discarded packets |
| A | 0 | 29 | 0 |
| B | 0 | 29 | 0 |
| C | 0 | 29 | 0 |
| D | 0 | 29 | 0 |
| Quadrant | Total seconds | Saturated seconds | Saturation percentage |
|---|---|---|---|
| A | 25606 | 331 | 1.292666% |
| B | 25606 | 255 | 0.995860% |
| C | 25606 | 210 | 0.820120% |
| D | 25606 | 351 | 1.370772% |
Noise dominated data is calculated using 1-second bins in cleaned event files. If a bin has >2000 counts, and if more than 50% of those come from <1% of pixels, then it is considered to be noise-dominated and hence unusable.
| Quadrant | # 1 sec bins | Bins with >0 counts | Bins with >2000 counts | High rate bins dominated by noise | Noise dominated (total time) | Noise dominated (detector-on time) | Marked lightcurve |
|---|---|---|---|---|---|---|---|
| A | 28457 | 25602 | 1 | 1 | 0.00% | 0.00% |  |
| B | 28457 | 25603 | 3 | 3 | 0.01% | 0.01% |  |
| C | 28457 | 25605 | 0 | 0 | 0.00% | 0.00% |  |
| D | 28457 | 25604 | 26 | 26 | 0.09% | 0.10% |  |
Top three noisy pixels from each quadrant. If the there are fewer than three noisy pixels in the level2.evt file, extra rows are filled as -1
| Pixel properties | Quadrant properties | ||||||
|---|---|---|---|---|---|---|---|
| Quadrant | DetID | PixID | Counts | Sigma | Mean | Median | Sigma |
| A | 0 | 253 | 2851438 | 10030.68 | 1277 | 1250 | 284.1 |
| A | 0 | 23 | 1633503 | 5744.4 | 1277 | 1250 | 284.1 |
| A | 1 | 162 | 136765 | 476.92 | 1277 | 1250 | 284.1 |
| B | 4 | 173 | 71059 | 280.84 | 1282 | 1245 | 248.6 |
| B | 0 | 205 | 70008 | 276.61 | 1282 | 1245 | 248.6 |
| B | 0 | 214 | 54100 | 212.62 | 1282 | 1245 | 248.6 |
| C | 3 | 233 | 4810604 | 17700.05 | 1230 | 1211 | 271.7 |
| C | 3 | 234 | 42390 | 151.55 | 1230 | 1211 | 271.7 |
| C | 9 | 54 | 35739 | 127.07 | 1230 | 1211 | 271.7 |
| D | 12 | 110 | 663221 | 2206.97 | 1257 | 1219 | 300.0 |
| D | 13 | 122 | 290396 | 964.05 | 1257 | 1219 | 300.0 |
| D | 5 | 222 | 245759 | 815.24 | 1257 | 1219 | 300.0 |
Histogram calculated using DETX and DETY for each event in the final _common_clean file
| Quadrant A |  |
 |
Quadrant B |
|---|---|---|---|
| Quadrant D | 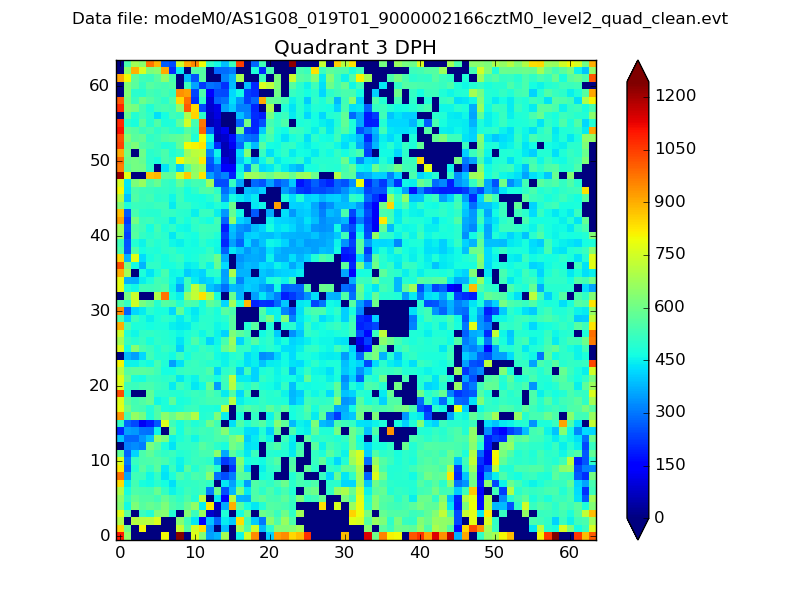 |
 |
Quadrant C |
| Plot type | Count rate plots | Images |
|---|---|---|
| Comparison with Poisson distribution Blue bars denote a histogram of data divided into 1 sec bins. Red curve is a Poisson curve with rate = median count rate of data. |
 |
 |
| Quadrant-wise count rates Data is divided into 100 sec bins |
 |
|
| Module-wise count rates for Quadrant A Data is divided into 100 sec bins |
 |
 |
| Module-wise count rates for Quadrant B Data is divided into 100 sec bins |
 |
 |
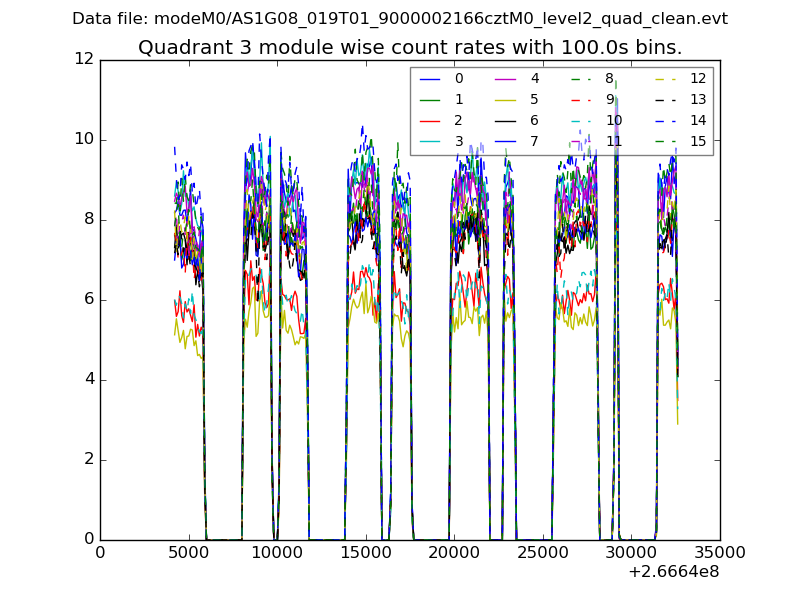
| Module-wise count rates for Quadrant C Data is divided into 100 sec bins |
 |
 |
| Module-wise count rates for Quadrant D Data is divided into 100 sec bins |
 |
 |
| Parameter | Plot |
|---|---|
| CZT HV Monitor |  |
| D_VDD | 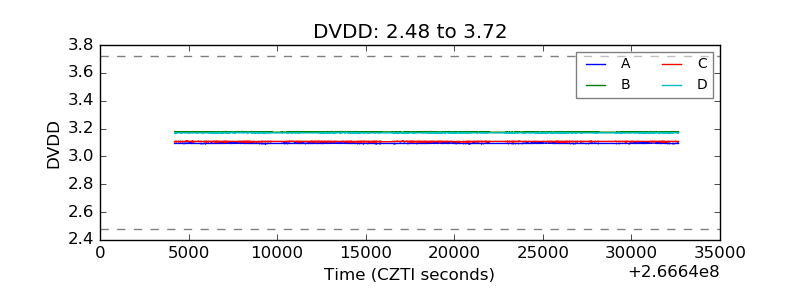 |
| Temperature 1 |  |
| Veto HV Monitor |  |
| Veto LLD |  |
| Alpha Counter | 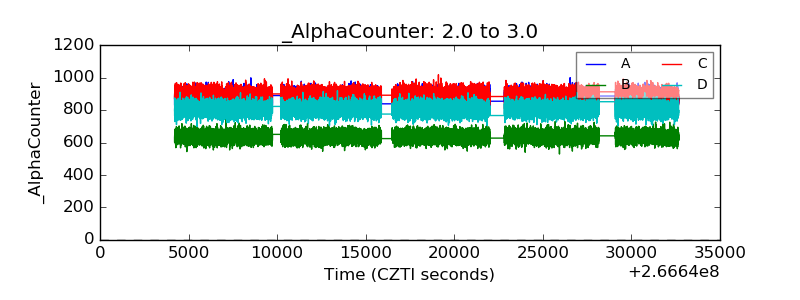 |
| _CPM_Rate |  |
| CZT Counter |  |
| +2.5 Volts monitor | 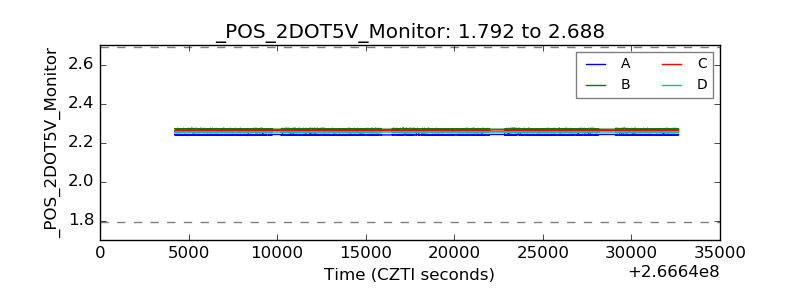 |
| +5 Volts monitor |  |
| _ROLL_ROT |  |
| _Roll_DEC |  |
| _Roll_RA |  |
| Veto Counter | 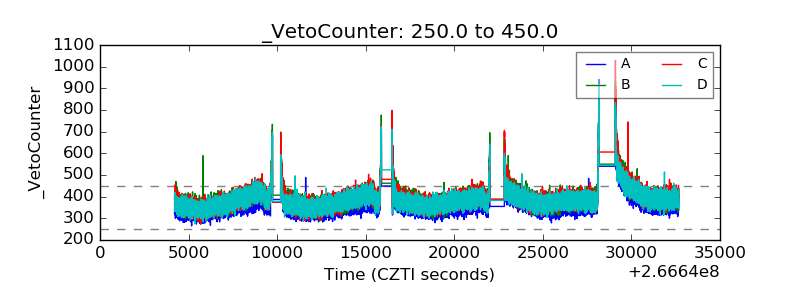 |