| Param | Original file | Final file |
|---|---|---|
| Filename | modeM0/AS1G08_076T02_9000002164cztM0_level2_bc.evt | modeM0/AS1G08_076T02_9000002164cztM0_level2_quad_clean.evt |
| Size (bytes) | 1,452,830,400 | 301,936,320 |
| Size | 1.4 GB | 287.9 MB |
| Events in quadrant A | 22,302,175 | 1,774,628 |
| Events in quadrant B | 5,635,783 | 1,945,020 |
| Events in quadrant C | 7,410,429 | 1,888,116 |
| Events in quadrant D | 6,978,028 | 1,845,037 |
| Mode SS | |||
|---|---|---|---|
| Quadrant | BADHDUFLAG | Total packets | Discarded packets |
| A | 0 | 502 | 0 |
| B | 0 | 502 | 0 |
| C | 0 | 502 | 0 |
| D | 0 | 502 | 0 |
| Mode M9 | |||
|---|---|---|---|
| Quadrant | BADHDUFLAG | Total packets | Discarded packets |
| A | 0 | 45 | 0 |
| B | 0 | 45 | 0 |
| C | 0 | 45 | 0 |
| D | 0 | 45 | 0 |
| Mode M0 | |||
|---|---|---|---|
| Quadrant | BADHDUFLAG | Total packets | Discarded packets |
| A | 0 | 106189 | 0 |
| B | 0 | 52838 | 0 |
| C | 0 | 58991 | 0 |
| D | 0 | 57043 | 0 |
| Quadrant | Total seconds | Saturated seconds | Saturation percentage |
|---|---|---|---|
| A | 24584 | 2964 | 12.056622% |
| B | 24585 | 235 | 0.955867% |
| C | 24585 | 153 | 0.622331% |
| D | 24585 | 476 | 1.936140% |
Noise dominated data is calculated using 1-second bins in cleaned event files. If a bin has >2000 counts, and if more than 50% of those come from <1% of pixels, then it is considered to be noise-dominated and hence unusable.
| Quadrant | # 1 sec bins | Bins with >0 counts | Bins with >2000 counts | High rate bins dominated by noise | Noise dominated (total time) | Noise dominated (detector-on time) | Marked lightcurve |
|---|---|---|---|---|---|---|---|
| A | 32925 | 24584 | 588 | 588 | 1.79% | 2.39% |  |
| B | 32925 | 24589 | 0 | 0 | 0.00% | 0.00% |  |
| C | 32925 | 24588 | 11 | 11 | 0.03% | 0.04% |  |
| D | 32925 | 24586 | 91 | 91 | 0.28% | 0.37% |  |
Top three noisy pixels from each quadrant. If the there are fewer than three noisy pixels in the level2.evt file, extra rows are filled as -1
| Pixel properties | Quadrant properties | ||||||
|---|---|---|---|---|---|---|---|
| Quadrant | DetID | PixID | Counts | Sigma | Mean | Median | Sigma |
| A | 0 | 253 | 9874007 | 36407.45 | 1238 | 1216 | 271.2 |
| A | 0 | 23 | 6883984 | 25381.27 | 1238 | 1216 | 271.2 |
| A | 0 | 226 | 420489 | 1546.13 | 1238 | 1216 | 271.2 |
| B | 0 | 189 | 162223 | 647.33 | 1307 | 1273 | 248.6 |
| B | 0 | 219 | 69866 | 275.88 | 1307 | 1273 | 248.6 |
| B | 0 | 190 | 54264 | 213.13 | 1307 | 1273 | 248.6 |
| C | 3 | 233 | 2340864 | 8456.08 | 1256 | 1239 | 276.7 |
| C | 0 | 207 | 112837 | 403.35 | 1256 | 1239 | 276.7 |
| C | 5 | 223 | 15977 | 53.27 | 1256 | 1239 | 276.7 |
| D | 10 | 199 | 712840 | 2246.66 | 1257 | 1224 | 316.7 |
| D | 12 | 110 | 505497 | 1592.05 | 1257 | 1224 | 316.7 |
| D | 13 | 122 | 254659 | 800.12 | 1257 | 1224 | 316.7 |
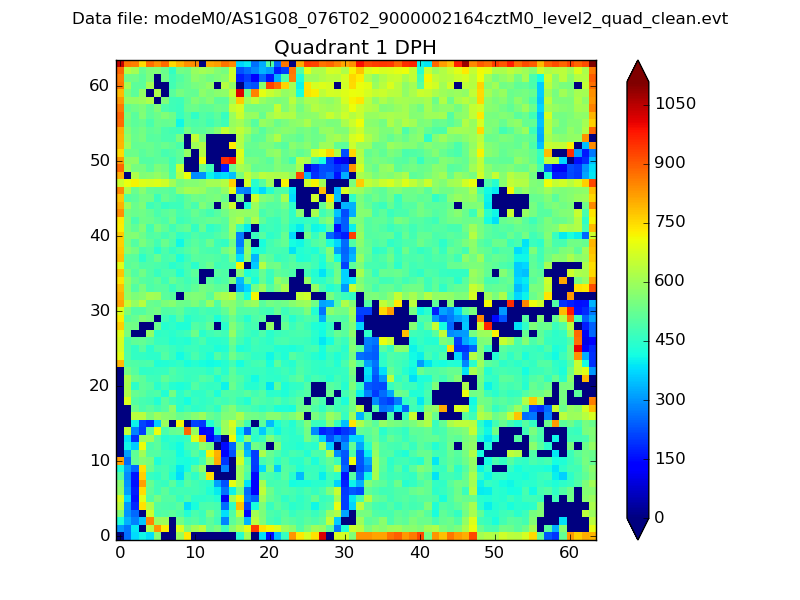
Histogram calculated using DETX and DETY for each event in the final _common_clean file
| Quadrant A |  |
 |
Quadrant B |
|---|---|---|---|
| Quadrant D |  |
 |
Quadrant C |
| Plot type | Count rate plots | Images |
|---|---|---|
| Comparison with Poisson distribution Blue bars denote a histogram of data divided into 1 sec bins. Red curve is a Poisson curve with rate = median count rate of data. |
 |
 |
| Quadrant-wise count rates Data is divided into 100 sec bins |
 |
|
| Module-wise count rates for Quadrant A Data is divided into 100 sec bins |
 |
 |
| Module-wise count rates for Quadrant B Data is divided into 100 sec bins |
 |
 |
| Module-wise count rates for Quadrant C Data is divided into 100 sec bins |
 |
 |
| Module-wise count rates for Quadrant D Data is divided into 100 sec bins |
 |
 |
| Parameter | Plot |
|---|---|
| CZT HV Monitor | 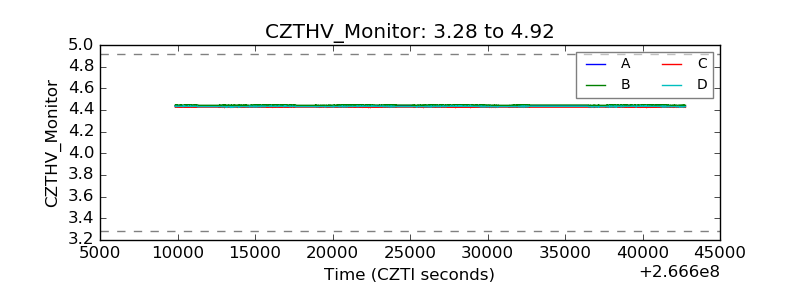 |
| D_VDD |  |
| Temperature 1 |  |
| Veto HV Monitor |  |
| Veto LLD | 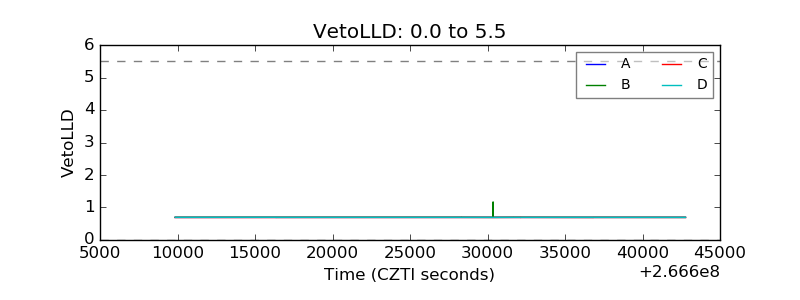 |
| Alpha Counter |  |
| _CPM_Rate |  |
| CZT Counter |  |
| +2.5 Volts monitor |  |
| +5 Volts monitor |  |
| _ROLL_ROT |  |
| _Roll_DEC | 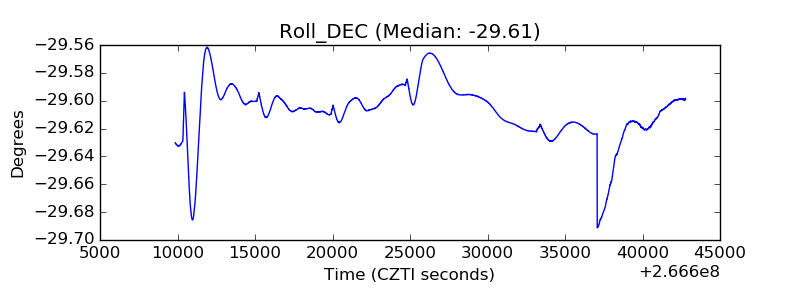 |
| _Roll_RA | 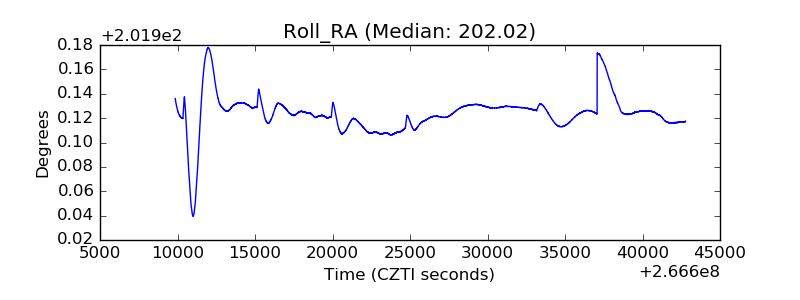 |
| Veto Counter |  |