| Param | Original file | Final file |
|---|---|---|
| Filename | modeM0/AS1A04_148T01_9000002162cztM0_level2_bc.evt | modeM0/AS1A04_148T01_9000002162cztM0_level2_quad_clean.evt |
| Size (bytes) | 647,902,080 | 204,324,480 |
| Size | 617.9 MB | 194.9 MB |
| Events in quadrant A | 5,974,173 | 1,257,231 |
| Events in quadrant B | 3,547,062 | 1,352,206 |
| Events in quadrant C | 5,020,973 | 1,331,098 |
| Events in quadrant D | 4,135,929 | 1,296,275 |
| Mode SS | |||
|---|---|---|---|
| Quadrant | BADHDUFLAG | Total packets | Discarded packets |
| A | 0 | 280 | 0 |
| B | 0 | 280 | 0 |
| C | 0 | 280 | 0 |
| D | 0 | 280 | 0 |
| Mode M0 | |||
|---|---|---|---|
| Quadrant | BADHDUFLAG | Total packets | Discarded packets |
| A | 0 | 42329 | 0 |
| B | 0 | 30992 | 0 |
| C | 0 | 36995 | 0 |
| D | 0 | 32835 | 0 |
| Mode M9 | |||
|---|---|---|---|
| Quadrant | BADHDUFLAG | Total packets | Discarded packets |
| A | 0 | 37 | 0 |
| B | 0 | 37 | 0 |
| C | 0 | 37 | 0 |
| D | 0 | 37 | 0 |
| Quadrant | Total seconds | Saturated seconds | Saturation percentage |
|---|---|---|---|
| A | 13779 | 1242 | 9.013717% |
| B | 13779 | 226 | 1.640177% |
| C | 13779 | 206 | 1.495029% |
| D | 13779 | 439 | 3.186008% |
Noise dominated data is calculated using 1-second bins in cleaned event files. If a bin has >2000 counts, and if more than 50% of those come from <1% of pixels, then it is considered to be noise-dominated and hence unusable.
| Quadrant | # 1 sec bins | Bins with >0 counts | Bins with >2000 counts | High rate bins dominated by noise | Noise dominated (total time) | Noise dominated (detector-on time) | Marked lightcurve |
|---|---|---|---|---|---|---|---|
| A | 17460 | 13777 | 16 | 16 | 0.09% | 0.12% |  |
| B | 17460 | 13777 | 2 | 2 | 0.01% | 0.01% |  |
| C | 17460 | 13778 | 0 | 0 | 0.00% | 0.00% |  |
| D | 17460 | 13777 | 58 | 58 | 0.33% | 0.42% |  |
Top three noisy pixels from each quadrant. If the there are fewer than three noisy pixels in the level2.evt file, extra rows are filled as -1
| Pixel properties | Quadrant properties | ||||||
|---|---|---|---|---|---|---|---|
| Quadrant | DetID | PixID | Counts | Sigma | Mean | Median | Sigma |
| A | 0 | 253 | 2313483 | 14023.33 | 769 | 758 | 164.9 |
| A | 0 | 23 | 257371 | 1555.99 | 769 | 758 | 164.9 |
| A | 8 | 15 | 154841 | 934.29 | 769 | 758 | 164.9 |
| B | 0 | 189 | 117027 | 761.28 | 814 | 797 | 152.7 |
| B | 0 | 219 | 48563 | 312.86 | 814 | 797 | 152.7 |
| B | 0 | 190 | 39343 | 252.47 | 814 | 797 | 152.7 |
| C | 3 | 233 | 1894913 | 11032.44 | 789 | 783 | 171.7 |
| C | 0 | 207 | 21394 | 120.05 | 789 | 783 | 171.7 |
| C | 14 | 225 | 5484 | 27.38 | 789 | 783 | 171.7 |
| D | 15 | 0 | 410257 | 2040.89 | 792 | 771 | 200.6 |
| D | 10 | 199 | 267629 | 1330.03 | 792 | 771 | 200.6 |
| D | 12 | 110 | 78379 | 386.8 | 792 | 771 | 200.6 |
Histogram calculated using DETX and DETY for each event in the final _common_clean file
| Quadrant A | 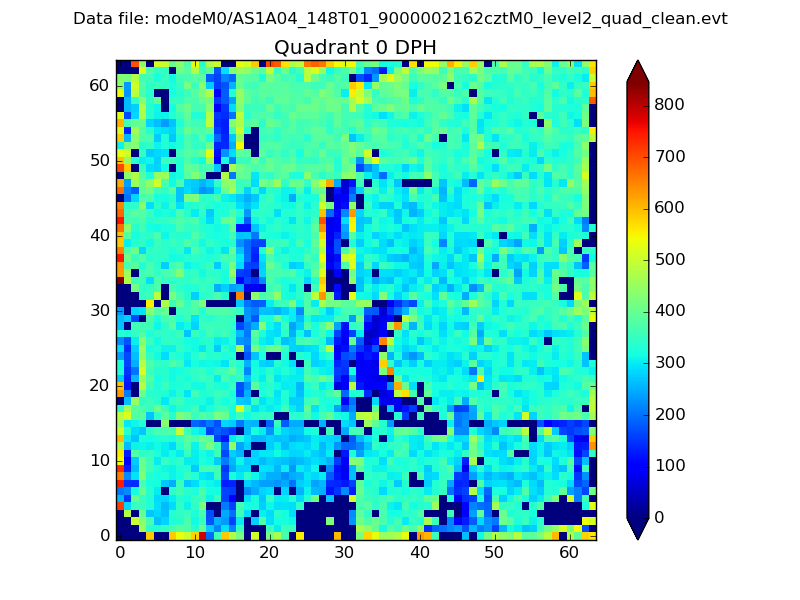 |
 |
Quadrant B |
|---|---|---|---|
| Quadrant D |  |
 |
Quadrant C |
| Plot type | Count rate plots | Images |
|---|---|---|
| Comparison with Poisson distribution Blue bars denote a histogram of data divided into 1 sec bins. Red curve is a Poisson curve with rate = median count rate of data. |
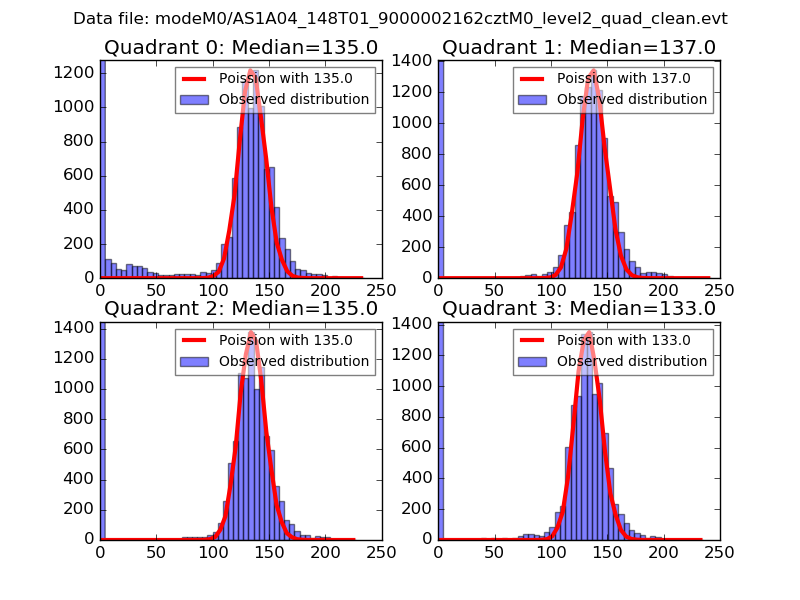 |
 |
| Quadrant-wise count rates Data is divided into 100 sec bins |
 |
|
| Module-wise count rates for Quadrant A Data is divided into 100 sec bins |
 |
 |
| Module-wise count rates for Quadrant B Data is divided into 100 sec bins |
 |
 |
| Module-wise count rates for Quadrant C Data is divided into 100 sec bins |
 |
 |
| Module-wise count rates for Quadrant D Data is divided into 100 sec bins |
 |
 |
| Parameter | Plot |
|---|---|
| CZT HV Monitor |  |
| D_VDD |  |
| Temperature 1 |  |
| Veto HV Monitor |  |
| Veto LLD |  |
| Alpha Counter |  |
| _CPM_Rate |  |
| CZT Counter |  |
| +2.5 Volts monitor |  |
| +5 Volts monitor |  |
| _ROLL_ROT |  |
| _Roll_DEC |  |
| _Roll_RA | 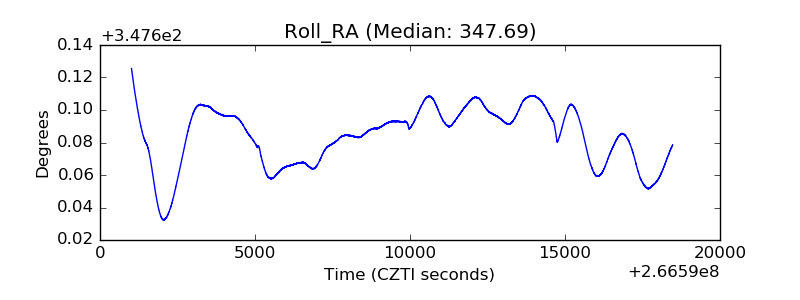 |
| Veto Counter |  |