| Param | Original file | Final file |
|---|---|---|
| Filename | modeM0/AS1A04_075T02_9000002158cztM0_level2_bc.evt | modeM0/AS1A04_075T02_9000002158cztM0_level2_quad_clean.evt |
| Size (bytes) | 391,944,960 | 128,286,720 |
| Size | 373.8 MB | 122.3 MB |
| Events in quadrant A | 2,792,704 | 814,870 |
| Events in quadrant B | 2,165,359 | 820,842 |
| Events in quadrant C | 4,088,161 | 797,611 |
| Events in quadrant D | 2,169,325 | 792,005 |
| Mode M0 | |||
|---|---|---|---|
| Quadrant | BADHDUFLAG | Total packets | Discarded packets |
| A | 0 | 22336 | 0 |
| B | 0 | 20214 | 0 |
| C | 0 | 28189 | 0 |
| D | 0 | 20297 | 0 |
| Mode SS | |||
|---|---|---|---|
| Quadrant | BADHDUFLAG | Total packets | Discarded packets |
| A | 0 | 190 | 0 |
| B | 0 | 190 | 0 |
| C | 0 | 190 | 0 |
| D | 0 | 190 | 0 |
| Mode M9 | |||
|---|---|---|---|
| Quadrant | BADHDUFLAG | Total packets | Discarded packets |
| A | 0 | 9 | 0 |
| B | 0 | 9 | 0 |
| C | 0 | 9 | 0 |
| D | 0 | 10 | 0 |
| Quadrant | Total seconds | Saturated seconds | Saturation percentage |
|---|---|---|---|
| A | 9520 | 58 | 0.609244% |
| B | 9520 | 77 | 0.808824% |
| C | 9520 | 57 | 0.598739% |
| D | 9520 | 74 | 0.777311% |
Noise dominated data is calculated using 1-second bins in cleaned event files. If a bin has >2000 counts, and if more than 50% of those come from <1% of pixels, then it is considered to be noise-dominated and hence unusable.
| Quadrant | # 1 sec bins | Bins with >0 counts | Bins with >2000 counts | High rate bins dominated by noise | Noise dominated (total time) | Noise dominated (detector-on time) | Marked lightcurve |
|---|---|---|---|---|---|---|---|
| A | 10230 | 9519 | 0 | 0 | 0.00% | 0.00% |  |
| B | 10230 | 9520 | 7 | 7 | 0.07% | 0.07% |  |
| C | 10230 | 9520 | 0 | 0 | 0.00% | 0.00% |  |
| D | 10230 | 9520 | 12 | 12 | 0.12% | 0.13% | 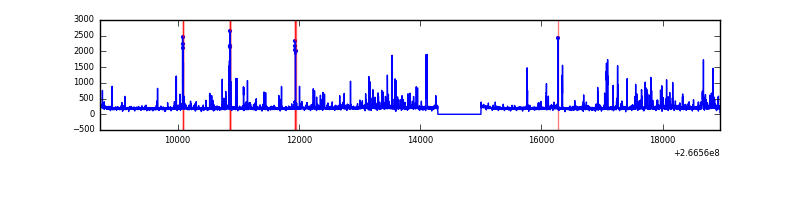 |
Top three noisy pixels from each quadrant. If the there are fewer than three noisy pixels in the level2.evt file, extra rows are filled as -1
| Pixel properties | Quadrant properties | ||||||
|---|---|---|---|---|---|---|---|
| Quadrant | DetID | PixID | Counts | Sigma | Mean | Median | Sigma |
| A | 0 | 23 | 432483 | 4120.27 | 461 | 450 | 104.9 |
| A | 8 | 15 | 201722 | 1919.52 | 461 | 450 | 104.9 |
| A | 1 | 162 | 111483 | 1058.91 | 461 | 450 | 104.9 |
| B | 10 | 16 | 71372 | 785.87 | 463 | 452 | 90.2 |
| B | 10 | 246 | 70422 | 775.35 | 463 | 452 | 90.2 |
| B | 0 | 219 | 44205 | 484.83 | 463 | 452 | 90.2 |
| C | 3 | 233 | 2297466 | 22792.64 | 444 | 437 | 100.8 |
| C | 3 | 234 | 21019 | 204.23 | 444 | 437 | 100.8 |
| C | 8 | 128 | 10207 | 96.94 | 444 | 437 | 100.8 |
| D | 12 | 110 | 144456 | 1322.89 | 451 | 436 | 108.9 |
| D | 10 | 199 | 61757 | 563.26 | 451 | 436 | 108.9 |
| D | 10 | 70 | 51664 | 470.55 | 451 | 436 | 108.9 |
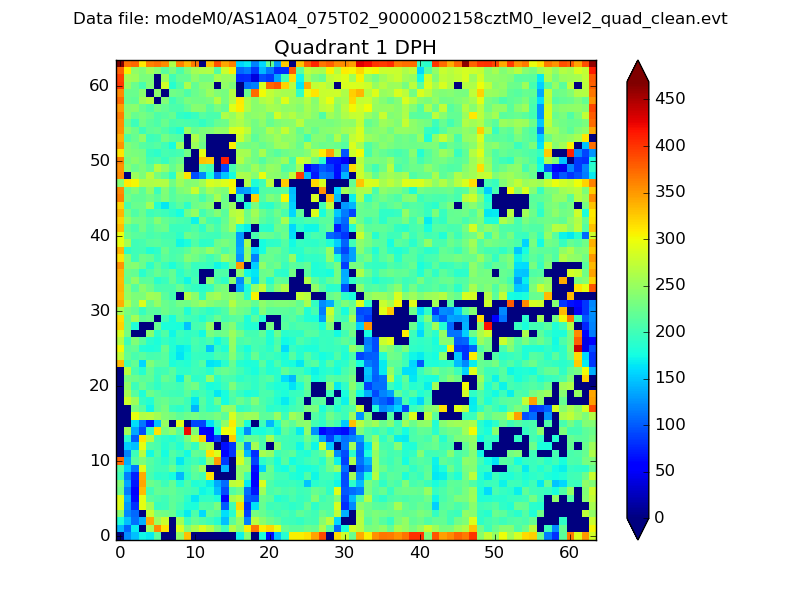
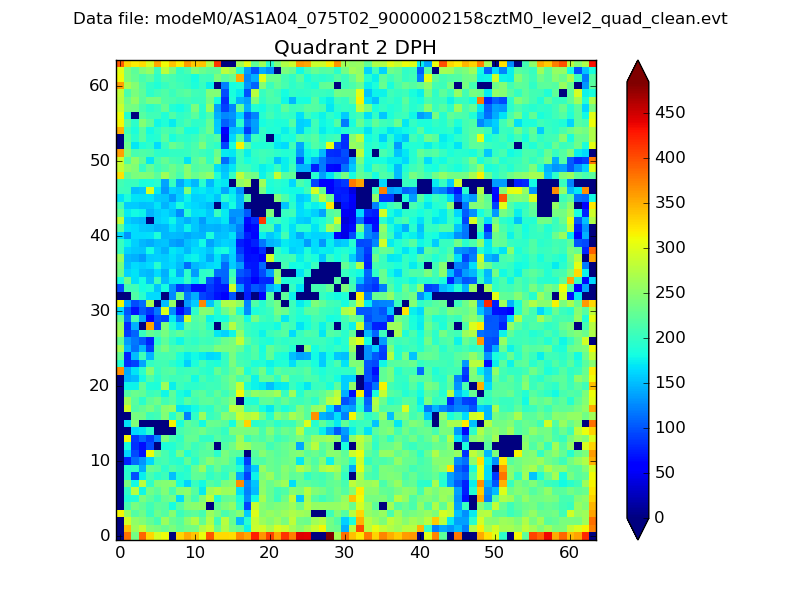
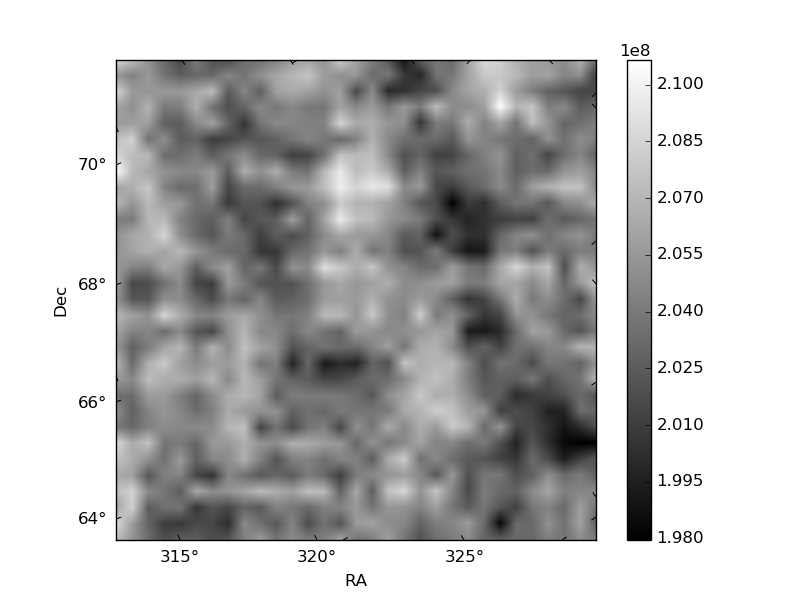
Histogram calculated using DETX and DETY for each event in the final _common_clean file
| Quadrant A |  |
 |
Quadrant B |
|---|---|---|---|
| Quadrant D |  |
 |
Quadrant C |
| Plot type | Count rate plots | Images |
|---|---|---|
| Comparison with Poisson distribution Blue bars denote a histogram of data divided into 1 sec bins. Red curve is a Poisson curve with rate = median count rate of data. |
 |
 |
| Quadrant-wise count rates Data is divided into 100 sec bins |
 |
|
| Module-wise count rates for Quadrant A Data is divided into 100 sec bins |
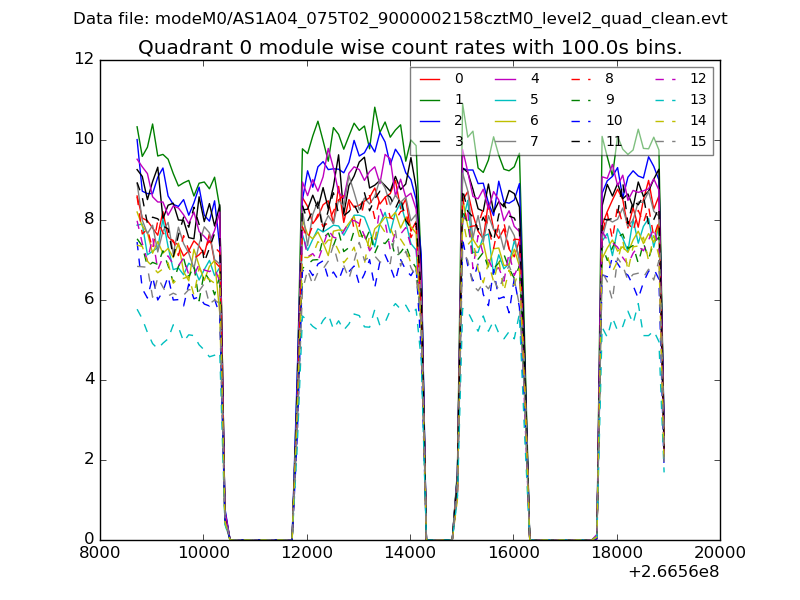 |
 |
| Module-wise count rates for Quadrant B Data is divided into 100 sec bins |
 |
 |
| Module-wise count rates for Quadrant C Data is divided into 100 sec bins |
 |
 |
| Module-wise count rates for Quadrant D Data is divided into 100 sec bins |
 |
 |
| Parameter | Plot |
|---|---|
| CZT HV Monitor | 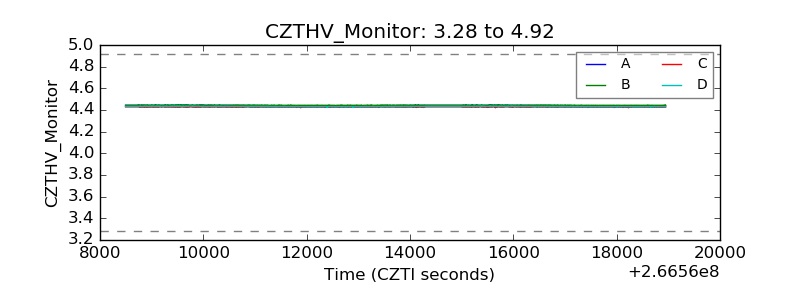 |
| D_VDD |  |
| Temperature 1 |  |
| Veto HV Monitor |  |
| Veto LLD |  |
| Alpha Counter |  |
| _CPM_Rate |  |
| CZT Counter |  |
| +2.5 Volts monitor |  |
| +5 Volts monitor |  |
| _ROLL_ROT |  |
| _Roll_DEC |  |
| _Roll_RA | 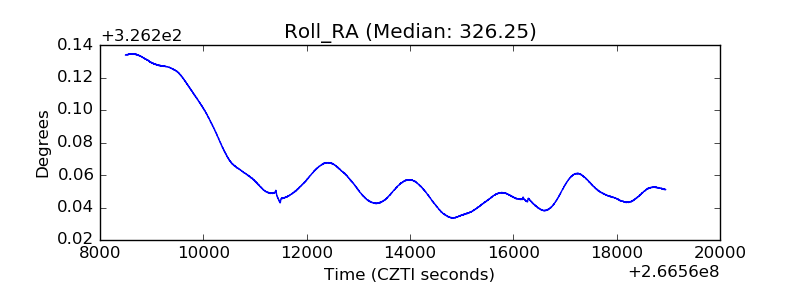 |
| Veto Counter |  |