| Param | Original file | Final file |
|---|---|---|
| Filename | modeM0/AS1G08_026T01_9000002154cztM0_level2_bc.evt | modeM0/AS1G08_026T01_9000002154cztM0_level2_quad_clean.evt |
| Size (bytes) | 2,154,078,720 | 627,373,440 |
| Size | 2.0 GB | 598.3 MB |
| Events in quadrant A | 11,799,518 | 3,948,891 |
| Events in quadrant B | 11,893,993 | 3,934,156 |
| Events in quadrant C | 24,030,410 | 3,799,545 |
| Events in quadrant D | 14,011,209 | 3,790,614 |
| Mode SS | |||
|---|---|---|---|
| Quadrant | BADHDUFLAG | Total packets | Discarded packets |
| A | 0 | 1046 | 0 |
| B | 0 | 1046 | 0 |
| C | 0 | 1046 | 0 |
| D | 0 | 1046 | 0 |
| Mode M0 | |||
|---|---|---|---|
| Quadrant | BADHDUFLAG | Total packets | Discarded packets |
| A | 0 | 112717 | 0 |
| B | 0 | 112281 | 0 |
| C | 0 | 161025 | 0 |
| D | 0 | 121572 | 0 |
| Mode M9 | |||
|---|---|---|---|
| Quadrant | BADHDUFLAG | Total packets | Discarded packets |
| A | 0 | 62 | 0 |
| B | 0 | 62 | 0 |
| C | 0 | 62 | 0 |
| D | 0 | 62 | 0 |
| Quadrant | Total seconds | Saturated seconds | Saturation percentage |
|---|---|---|---|
| A | 51427 | 630 | 1.225037% |
| B | 51427 | 892 | 1.734497% |
| C | 51427 | 757 | 1.471989% |
| D | 51427 | 1811 | 3.521496% |
Noise dominated data is calculated using 1-second bins in cleaned event files. If a bin has >2000 counts, and if more than 50% of those come from <1% of pixels, then it is considered to be noise-dominated and hence unusable.
| Quadrant | # 1 sec bins | Bins with >0 counts | Bins with >2000 counts | High rate bins dominated by noise | Noise dominated (total time) | Noise dominated (detector-on time) | Marked lightcurve |
|---|---|---|---|---|---|---|---|
| A | 57613 | 51423 | 4 | 4 | 0.01% | 0.01% | 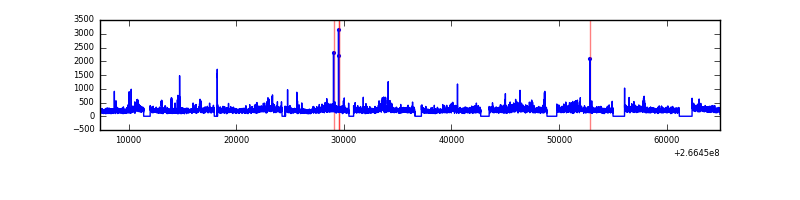 |
| B | 57613 | 51422 | 17 | 17 | 0.03% | 0.03% |  |
| C | 57613 | 51423 | 0 | 0 | 0.00% | 0.00% | 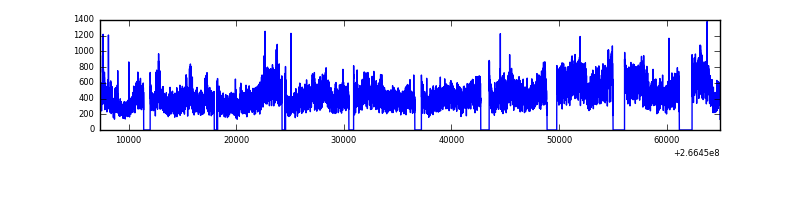 |
| D | 57613 | 51422 | 202 | 202 | 0.35% | 0.39% |  |
Top three noisy pixels from each quadrant. If the there are fewer than three noisy pixels in the level2.evt file, extra rows are filled as -1
| Pixel properties | Quadrant properties | ||||||
|---|---|---|---|---|---|---|---|
| Quadrant | DetID | PixID | Counts | Sigma | Mean | Median | Sigma |
| A | 0 | 23 | 612722 | 1053.08 | 2650 | 2589 | 579.4 |
| A | 1 | 162 | 489581 | 840.54 | 2650 | 2589 | 579.4 |
| A | 8 | 15 | 193324 | 329.21 | 2650 | 2589 | 579.4 |
| B | 0 | 189 | 512077 | 1013.04 | 2646 | 2572 | 502.9 |
| B | 10 | 16 | 392637 | 775.56 | 2646 | 2572 | 502.9 |
| B | 0 | 229 | 230543 | 453.27 | 2646 | 2572 | 502.9 |
| C | 3 | 233 | 13962610 | 25173.36 | 2543 | 2507 | 554.6 |
| C | 3 | 234 | 74368 | 129.58 | 2543 | 2507 | 554.6 |
| C | 3 | 232 | 31338 | 51.99 | 2543 | 2507 | 554.6 |
| D | 10 | 199 | 2198509 | 3687.59 | 2580 | 2502 | 595.5 |
| D | 12 | 110 | 972722 | 1629.22 | 2580 | 2502 | 595.5 |
| D | 13 | 122 | 341280 | 568.88 | 2580 | 2502 | 595.5 |
Histogram calculated using DETX and DETY for each event in the final _common_clean file
| Quadrant A |  |
 |
Quadrant B |
|---|---|---|---|
| Quadrant D | 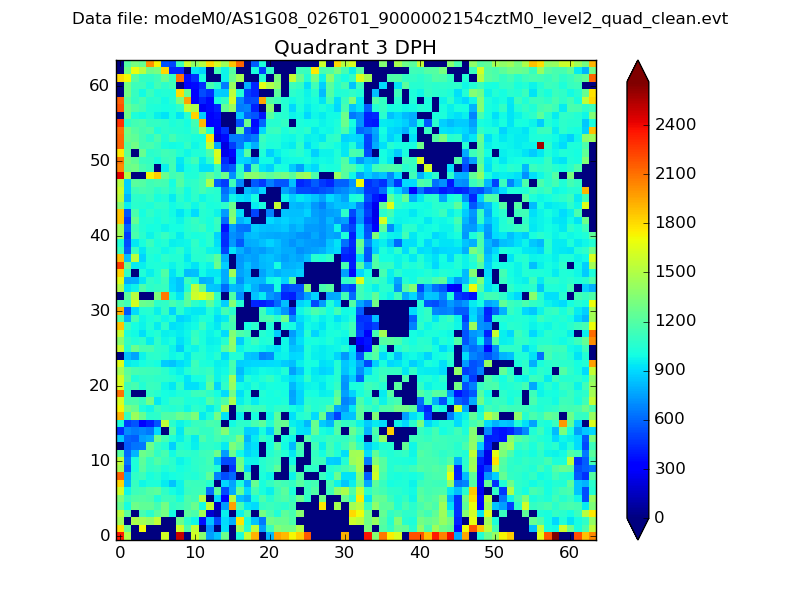 |
 |
Quadrant C |
| Plot type | Count rate plots | Images |
|---|---|---|
| Comparison with Poisson distribution Blue bars denote a histogram of data divided into 1 sec bins. Red curve is a Poisson curve with rate = median count rate of data. |
 |
 |
| Quadrant-wise count rates Data is divided into 100 sec bins |
 |
|
| Module-wise count rates for Quadrant A Data is divided into 100 sec bins |
 |
 |
| Module-wise count rates for Quadrant B Data is divided into 100 sec bins |
 |
 |
| Module-wise count rates for Quadrant C Data is divided into 100 sec bins |
 |
 |
| Module-wise count rates for Quadrant D Data is divided into 100 sec bins |
 |
 |
| Parameter | Plot |
|---|---|
| CZT HV Monitor |  |
| D_VDD |  |
| Temperature 1 |  |
| Veto HV Monitor |  |
| Veto LLD |  |
| Alpha Counter |  |
| _CPM_Rate |  |
| CZT Counter |  |
| +2.5 Volts monitor |  |
| +5 Volts monitor |  |
| _ROLL_ROT |  |
| _Roll_DEC |  |
| _Roll_RA |  |
| Veto Counter |  |