| Param | Original file | Final file |
|---|---|---|
| Filename | modeM0/AS1A04_016T01_9000002152cztM0_level2_bc.evt | modeM0/AS1A04_016T01_9000002152cztM0_level2_quad_clean.evt |
| Size (bytes) | 2,021,218,560 | 740,790,720 |
| Size | 1.9 GB | 706.5 MB |
| Events in quadrant A | 12,432,835 | 4,734,072 |
| Events in quadrant B | 12,010,869 | 4,792,568 |
| Events in quadrant C | 16,942,366 | 4,686,901 |
| Events in quadrant D | 16,175,630 | 4,549,316 |
| Mode M9 | |||
|---|---|---|---|
| Quadrant | BADHDUFLAG | Total packets | Discarded packets |
| A | 0 | 107 | 0 |
| B | 0 | 107 | 0 |
| C | 0 | 107 | 0 |
| D | 0 | 107 | 0 |
| Mode M0 | |||
|---|---|---|---|
| Quadrant | BADHDUFLAG | Total packets | Discarded packets |
| A | 0 | 117073 | 0 |
| B | 0 | 114296 | 0 |
| C | 0 | 133547 | 0 |
| D | 0 | 129754 | 0 |
| Mode SS | |||
|---|---|---|---|
| Quadrant | BADHDUFLAG | Total packets | Discarded packets |
| A | 0 | 1092 | 0 |
| B | 0 | 1092 | 0 |
| C | 0 | 1092 | 0 |
| D | 0 | 1092 | 0 |
| Quadrant | Total seconds | Saturated seconds | Saturation percentage |
|---|---|---|---|
| A | 53581 | 635 | 1.185122% |
| B | 53581 | 787 | 1.468804% |
| C | 53581 | 594 | 1.108602% |
| D | 53581 | 1827 | 3.409791% |
Noise dominated data is calculated using 1-second bins in cleaned event files. If a bin has >2000 counts, and if more than 50% of those come from <1% of pixels, then it is considered to be noise-dominated and hence unusable.
| Quadrant | # 1 sec bins | Bins with >0 counts | Bins with >2000 counts | High rate bins dominated by noise | Noise dominated (total time) | Noise dominated (detector-on time) | Marked lightcurve |
|---|---|---|---|---|---|---|---|
| A | 64198 | 53580 | 1 | 1 | 0.00% | 0.00% |  |
| B | 64198 | 53579 | 4 | 4 | 0.01% | 0.01% |  |
| C | 64198 | 53577 | 2 | 2 | 0.00% | 0.00% | 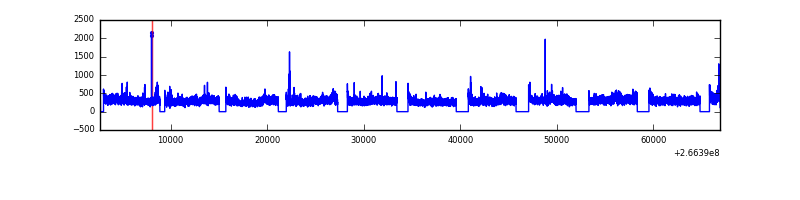 |
| D | 64198 | 53579 | 185 | 185 | 0.29% | 0.35% |  |
Top three noisy pixels from each quadrant. If the there are fewer than three noisy pixels in the level2.evt file, extra rows are filled as -1
| Pixel properties | Quadrant properties | ||||||
|---|---|---|---|---|---|---|---|
| Quadrant | DetID | PixID | Counts | Sigma | Mean | Median | Sigma |
| A | 1 | 162 | 548660 | 876.28 | 2865 | 2805 | 622.9 |
| A | 0 | 23 | 290209 | 461.38 | 2865 | 2805 | 622.9 |
| A | 8 | 15 | 240866 | 382.17 | 2865 | 2805 | 622.9 |
| B | 0 | 229 | 239599 | 441.11 | 2894 | 2817 | 536.8 |
| B | 0 | 189 | 209055 | 384.21 | 2894 | 2817 | 536.8 |
| B | 0 | 214 | 136841 | 249.68 | 2894 | 2817 | 536.8 |
| C | 3 | 233 | 5875120 | 9546.44 | 2821 | 2780 | 615.1 |
| C | 13 | 61 | 16538 | 22.37 | 2821 | 2780 | 615.1 |
| C | 3 | 232 | 12157 | 15.24 | 2821 | 2780 | 615.1 |
| D | 10 | 199 | 2271662 | 3545.9 | 2802 | 2724 | 639.9 |
| D | 12 | 110 | 1790744 | 2794.32 | 2802 | 2724 | 639.9 |
| D | 10 | 70 | 788655 | 1228.25 | 2802 | 2724 | 639.9 |
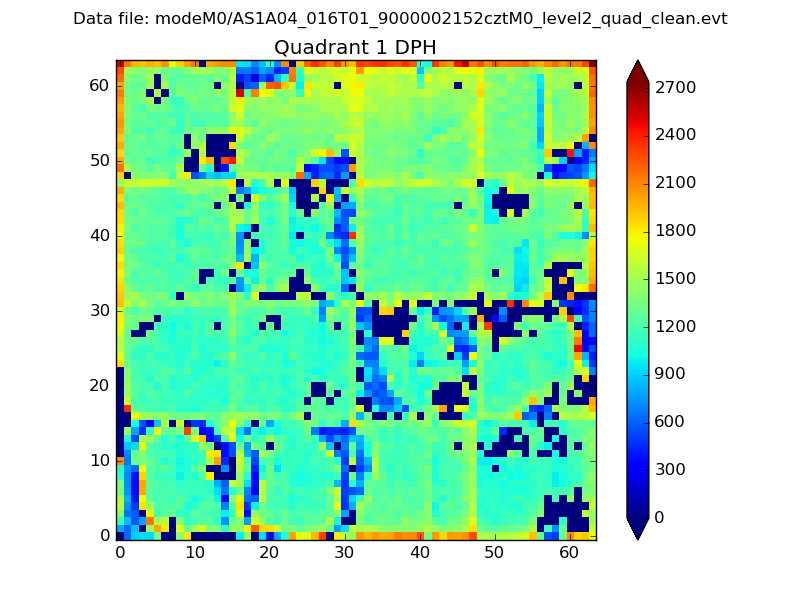
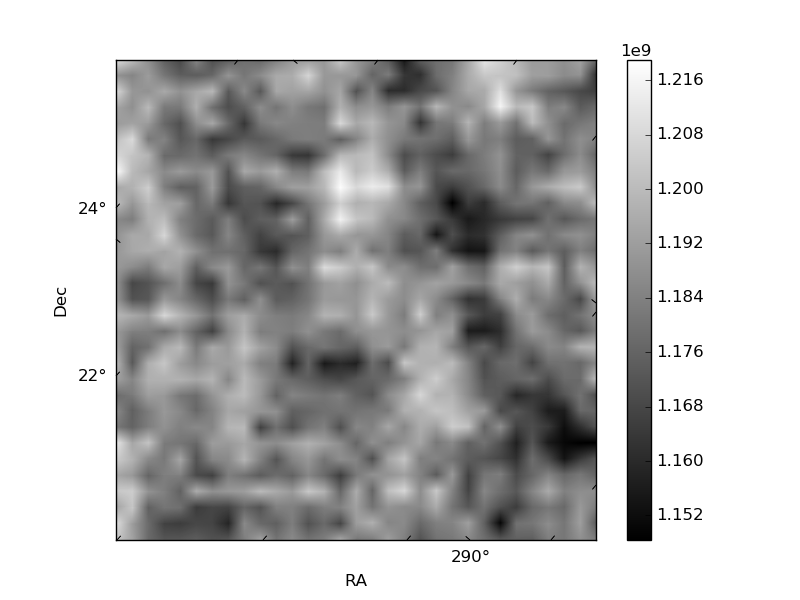
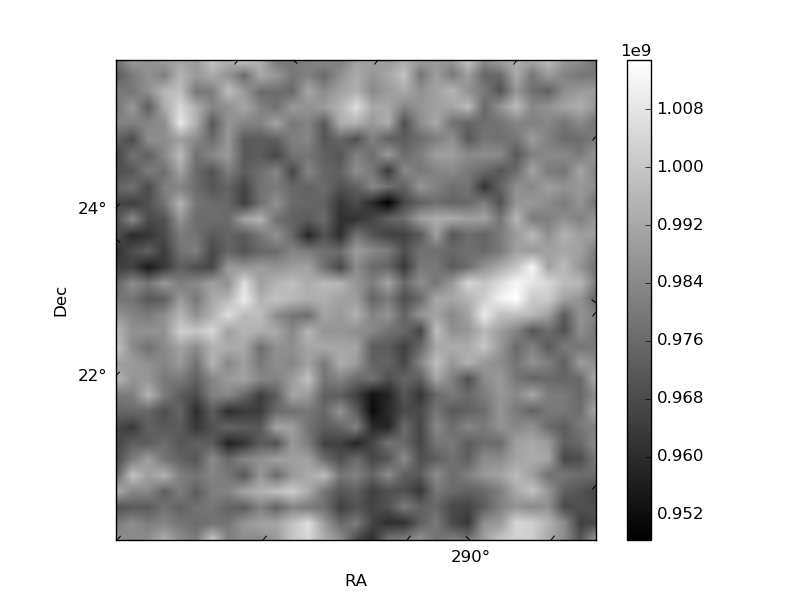
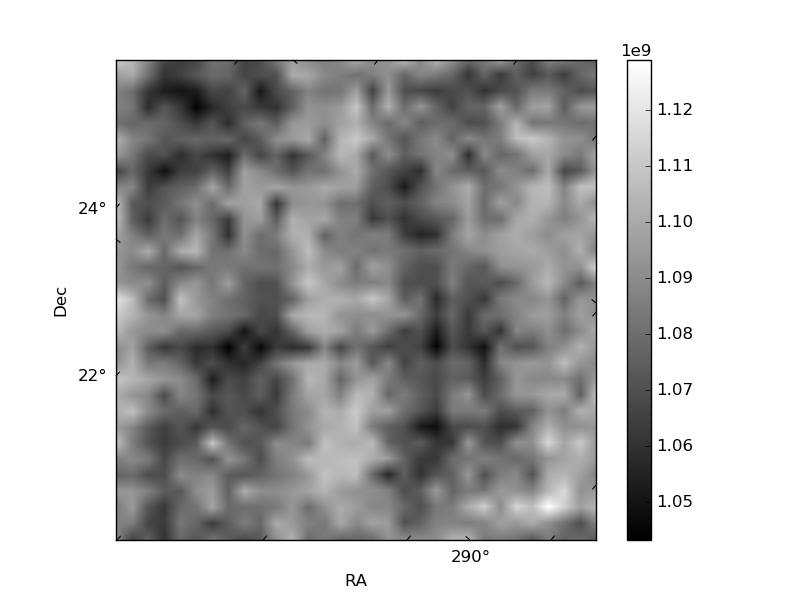
Histogram calculated using DETX and DETY for each event in the final _common_clean file
| Quadrant A |  |
 |
Quadrant B |
|---|---|---|---|
| Quadrant D |  |
 |
Quadrant C |
| Plot type | Count rate plots | Images |
|---|---|---|
| Comparison with Poisson distribution Blue bars denote a histogram of data divided into 1 sec bins. Red curve is a Poisson curve with rate = median count rate of data. |
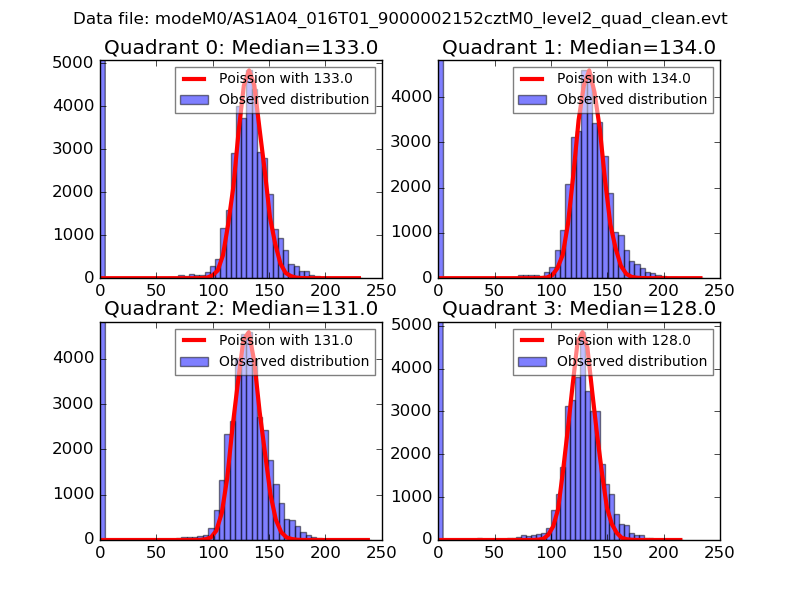 |
 |
| Quadrant-wise count rates Data is divided into 100 sec bins |
 |
|
| Module-wise count rates for Quadrant A Data is divided into 100 sec bins |
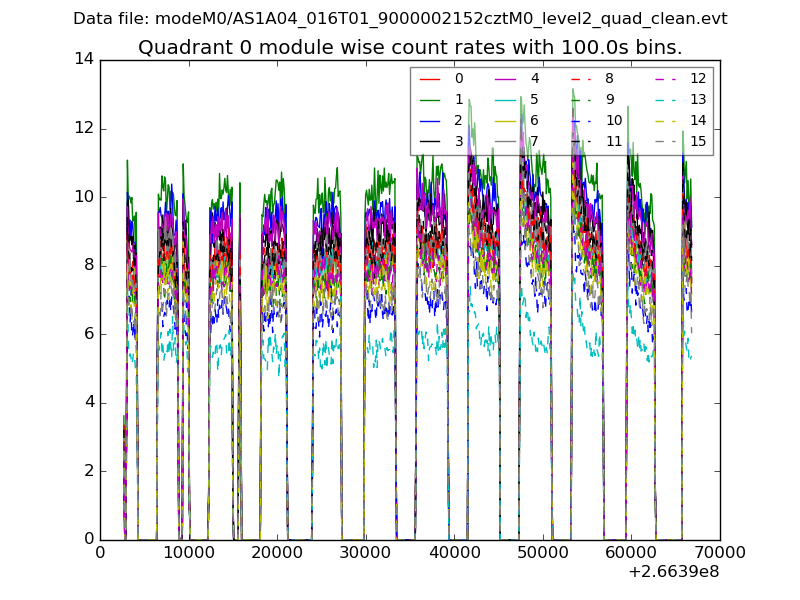 |
 |
| Module-wise count rates for Quadrant B Data is divided into 100 sec bins |
 |
 |
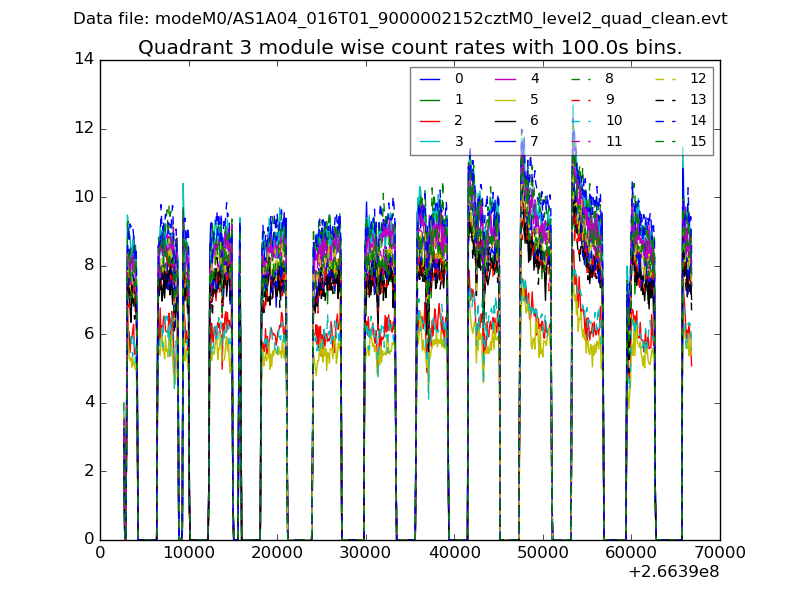
| Module-wise count rates for Quadrant C Data is divided into 100 sec bins |
 |
 |
| Module-wise count rates for Quadrant D Data is divided into 100 sec bins |
 |
 |
| Parameter | Plot |
|---|---|
| CZT HV Monitor |  |
| D_VDD |  |
| Temperature 1 | 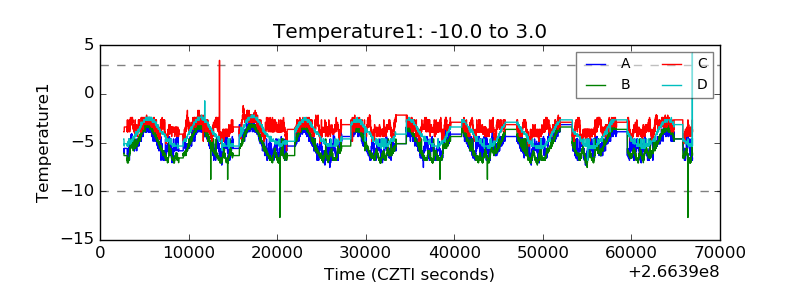 |
| Veto HV Monitor |  |
| Veto LLD |  |
| Alpha Counter |  |
| _CPM_Rate |  |
| CZT Counter |  |
| +2.5 Volts monitor |  |
| +5 Volts monitor |  |
| _ROLL_ROT |  |
| _Roll_DEC | 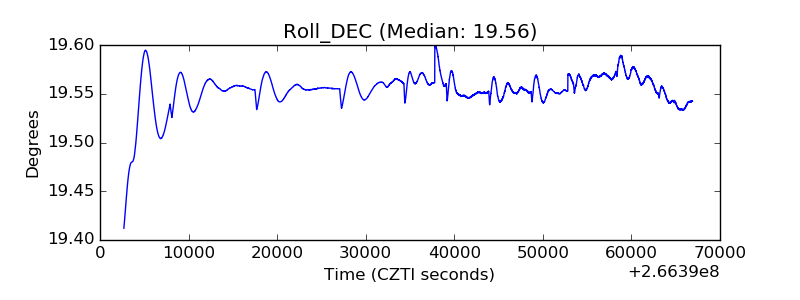 |
| _Roll_RA |  |
| Veto Counter |  |