| Param | Original file | Final file |
|---|---|---|
| Filename | modeM0/AS1G08_059T01_9000002150cztM0_level2_bc.evt | modeM0/AS1G08_059T01_9000002150cztM0_level2_quad_clean.evt |
| Size (bytes) | 901,532,160 | 293,500,800 |
| Size | 859.8 MB | 279.9 MB |
| Events in quadrant A | 6,829,155 | 1,820,233 |
| Events in quadrant B | 5,236,284 | 1,818,574 |
| Events in quadrant C | 7,454,383 | 1,788,485 |
| Events in quadrant D | 6,104,764 | 1,772,766 |
| Mode SS | |||
|---|---|---|---|
| Quadrant | BADHDUFLAG | Total packets | Discarded packets |
| A | 0 | 500 | 0 |
| B | 0 | 500 | 0 |
| C | 0 | 500 | 0 |
| D | 0 | 500 | 0 |
| Mode M9 | |||
|---|---|---|---|
| Quadrant | BADHDUFLAG | Total packets | Discarded packets |
| A | 0 | 26 | 0 |
| B | 0 | 26 | 0 |
| C | 0 | 26 | 0 |
| D | 0 | 26 | 0 |
| Mode M0 | |||
|---|---|---|---|
| Quadrant | BADHDUFLAG | Total packets | Discarded packets |
| A | 0 | 57827 | 0 |
| B | 0 | 51922 | 0 |
| C | 0 | 60247 | 0 |
| D | 0 | 54356 | 0 |
| Quadrant | Total seconds | Saturated seconds | Saturation percentage |
|---|---|---|---|
| A | 24554 | 535 | 2.178871% |
| B | 24554 | 343 | 1.396921% |
| C | 24554 | 201 | 0.818604% |
| D | 24554 | 386 | 1.572045% |
Noise dominated data is calculated using 1-second bins in cleaned event files. If a bin has >2000 counts, and if more than 50% of those come from <1% of pixels, then it is considered to be noise-dominated and hence unusable.
| Quadrant | # 1 sec bins | Bins with >0 counts | Bins with >2000 counts | High rate bins dominated by noise | Noise dominated (total time) | Noise dominated (detector-on time) | Marked lightcurve |
|---|---|---|---|---|---|---|---|
| A | 27190 | 24557 | 0 | 0 | 0.00% | 0.00% |  |
| B | 27190 | 24557 | 2 | 2 | 0.01% | 0.01% | 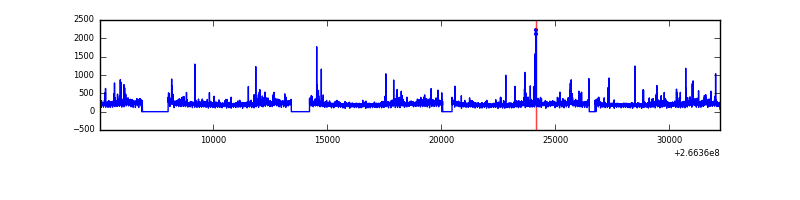 |
| C | 27190 | 24557 | 2 | 2 | 0.01% | 0.01% | 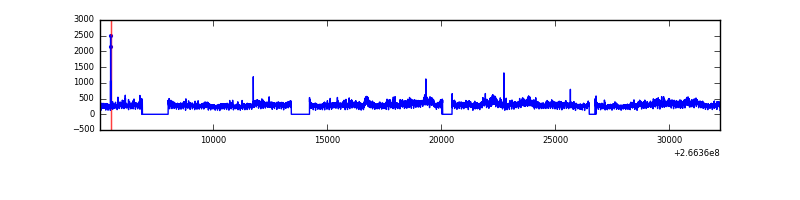 |
| D | 27190 | 24557 | 58 | 58 | 0.21% | 0.24% |  |
Top three noisy pixels from each quadrant. If the there are fewer than three noisy pixels in the level2.evt file, extra rows are filled as -1
| Pixel properties | Quadrant properties | ||||||
|---|---|---|---|---|---|---|---|
| Quadrant | DetID | PixID | Counts | Sigma | Mean | Median | Sigma |
| A | 0 | 23 | 1420141 | 5205.95 | 1246 | 1218 | 272.6 |
| A | 1 | 162 | 257454 | 940.11 | 1246 | 1218 | 272.6 |
| A | 8 | 15 | 152551 | 555.23 | 1246 | 1218 | 272.6 |
| B | 0 | 205 | 72967 | 298.19 | 1255 | 1222 | 240.6 |
| B | 0 | 214 | 70311 | 287.15 | 1255 | 1222 | 240.6 |
| B | 0 | 189 | 68692 | 280.42 | 1255 | 1222 | 240.6 |
| C | 3 | 233 | 2643412 | 9826.91 | 1220 | 1199 | 268.9 |
| C | 8 | 128 | 12629 | 42.51 | 1220 | 1199 | 268.9 |
| C | 14 | 234 | 11856 | 39.63 | 1220 | 1199 | 268.9 |
| D | 10 | 199 | 649651 | 2272.56 | 1232 | 1195 | 285.3 |
| D | 12 | 110 | 302427 | 1055.69 | 1232 | 1195 | 285.3 |
| D | 2 | 152 | 172211 | 599.34 | 1232 | 1195 | 285.3 |
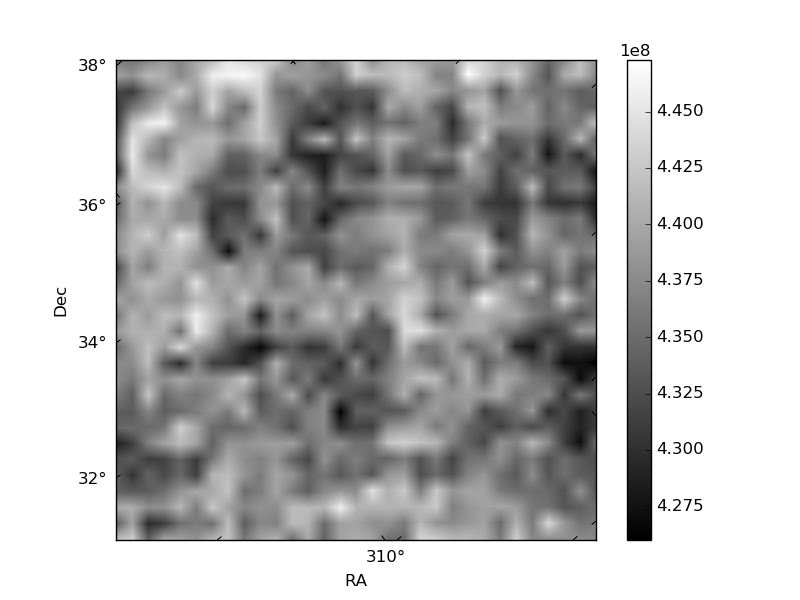
Histogram calculated using DETX and DETY for each event in the final _common_clean file
| Quadrant A | 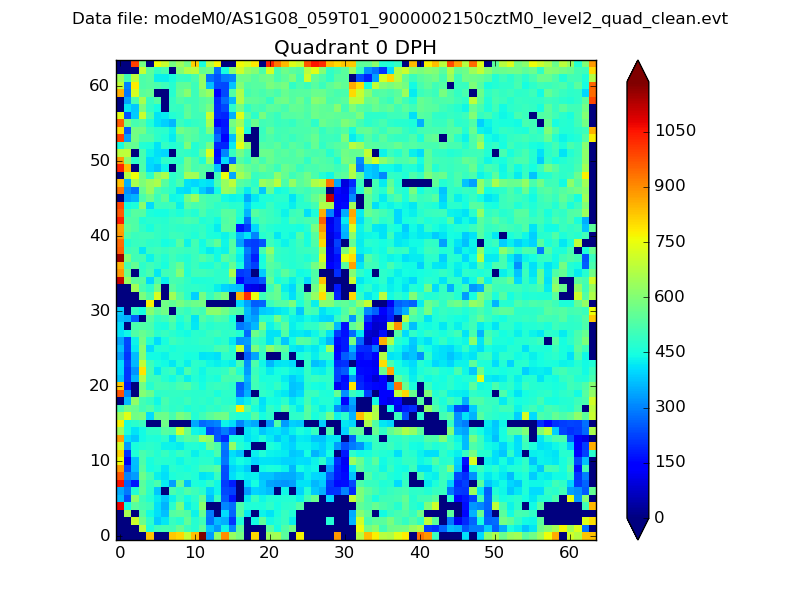 |
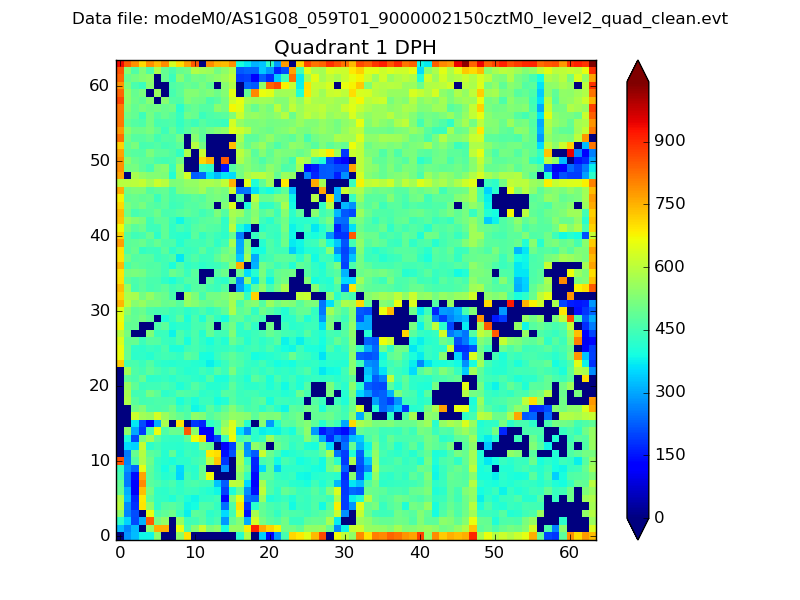 |
Quadrant B |
|---|---|---|---|
| Quadrant D |  |
 |
Quadrant C |
| Plot type | Count rate plots | Images |
|---|---|---|
| Comparison with Poisson distribution Blue bars denote a histogram of data divided into 1 sec bins. Red curve is a Poisson curve with rate = median count rate of data. |
 |
 |
| Quadrant-wise count rates Data is divided into 100 sec bins |
 |
|
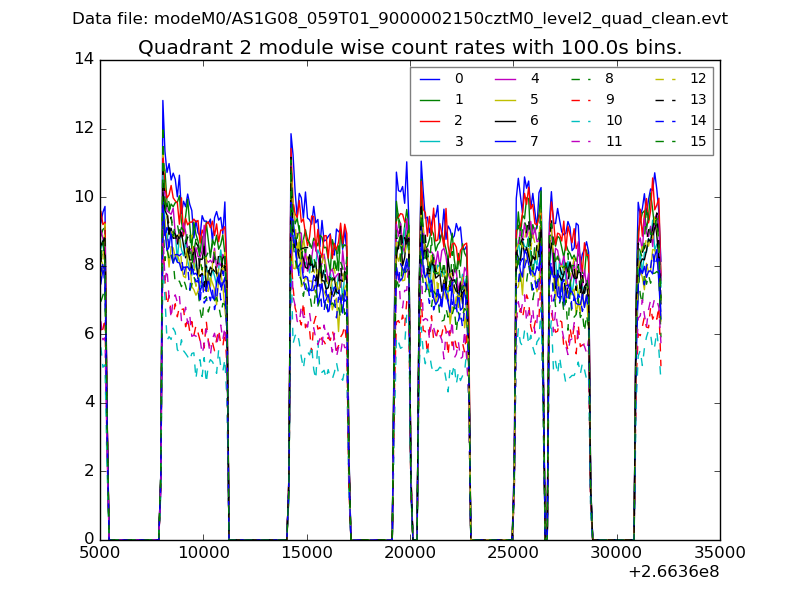
| Module-wise count rates for Quadrant A Data is divided into 100 sec bins |
 |
 |
| Module-wise count rates for Quadrant B Data is divided into 100 sec bins |
 |
 |
| Module-wise count rates for Quadrant C Data is divided into 100 sec bins |
 |
 |
| Module-wise count rates for Quadrant D Data is divided into 100 sec bins |
 |
 |
| Parameter | Plot |
|---|---|
| CZT HV Monitor | 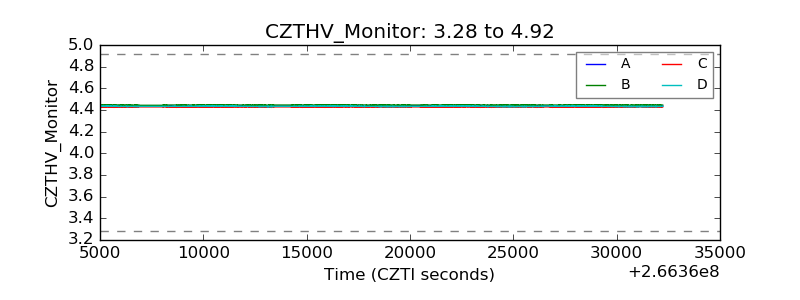 |
| D_VDD |  |
| Temperature 1 | 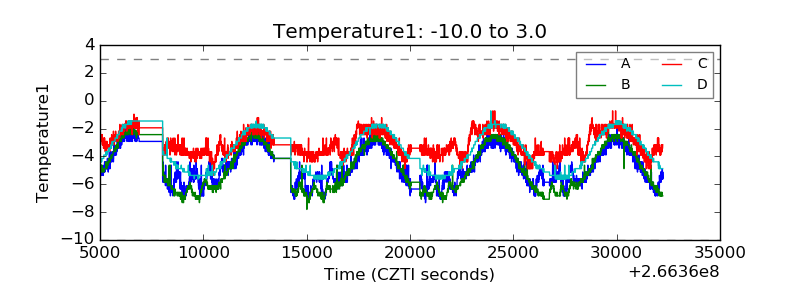 |
| Veto HV Monitor |  |
| Veto LLD |  |
| Alpha Counter |  |
| _CPM_Rate |  |
| CZT Counter | 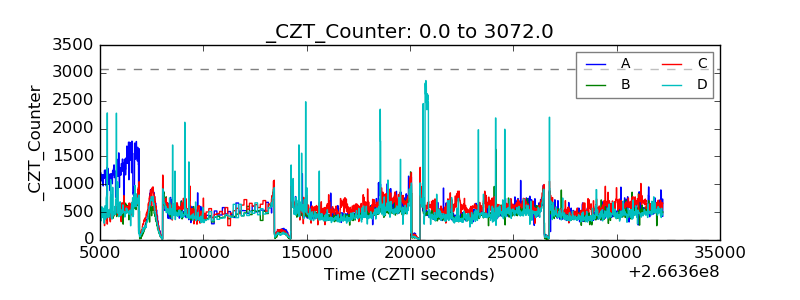 |
| +2.5 Volts monitor |  |
| +5 Volts monitor |  |
| _ROLL_ROT |  |
| _Roll_DEC |  |
| _Roll_RA |  |
| Veto Counter |  |