| Param | Original file | Final file |
|---|---|---|
| Filename | modeM0/AS1G08_055T02_9000002148cztM0_level2_bc.evt | modeM0/AS1G08_055T02_9000002148cztM0_level2_quad_clean.evt |
| Size (bytes) | 5,933,695,680 | 1,460,620,800 |
| Size | 5.5 GB | 1.4 GB |
| Events in quadrant A | 84,479,174 | 9,135,367 |
| Events in quadrant B | 23,967,450 | 9,525,802 |
| Events in quadrant C | 31,781,417 | 9,349,021 |
| Events in quadrant D | 32,378,635 | 9,057,815 |
| Mode SS | |||
|---|---|---|---|
| Quadrant | BADHDUFLAG | Total packets | Discarded packets |
| A | 0 | 2134 | 0 |
| B | 0 | 2134 | 0 |
| C | 0 | 2134 | 0 |
| D | 0 | 2134 | 0 |
| Mode M0 | |||
|---|---|---|---|
| Quadrant | BADHDUFLAG | Total packets | Discarded packets |
| A | 0 | 417106 | 0 |
| B | 0 | 225419 | 0 |
| C | 0 | 252253 | 0 |
| D | 0 | 266152 | 0 |
| Mode M9 | |||
|---|---|---|---|
| Quadrant | BADHDUFLAG | Total packets | Discarded packets |
| A | 0 | 192 | 0 |
| B | 0 | 192 | 0 |
| C | 0 | 192 | 0 |
| D | 0 | 192 | 0 |
| Quadrant | Total seconds | Saturated seconds | Saturation percentage |
|---|---|---|---|
| A | 104671 | 6034 | 5.764729% |
| B | 104671 | 1584 | 1.513313% |
| C | 104671 | 1138 | 1.087216% |
| D | 104671 | 5546 | 5.298507% |
Noise dominated data is calculated using 1-second bins in cleaned event files. If a bin has >2000 counts, and if more than 50% of those come from <1% of pixels, then it is considered to be noise-dominated and hence unusable.
| Quadrant | # 1 sec bins | Bins with >0 counts | Bins with >2000 counts | High rate bins dominated by noise | Noise dominated (total time) | Noise dominated (detector-on time) | Marked lightcurve |
|---|---|---|---|---|---|---|---|
| A | 123907 | 104666 | 16 | 16 | 0.01% | 0.02% |  |
| B | 123907 | 104663 | 82 | 82 | 0.07% | 0.08% |  |
| C | 123907 | 104668 | 0 | 0 | 0.00% | 0.00% |  |
| D | 123907 | 104663 | 379 | 379 | 0.31% | 0.36% |  |
Top three noisy pixels from each quadrant. If the there are fewer than three noisy pixels in the level2.evt file, extra rows are filled as -1
| Pixel properties | Quadrant properties | ||||||
|---|---|---|---|---|---|---|---|
| Quadrant | DetID | PixID | Counts | Sigma | Mean | Median | Sigma |
| A | 0 | 23 | 58057631 | 48780.62 | 5484 | 5381 | 1190.1 |
| A | 0 | 226 | 3345392 | 2806.57 | 5484 | 5381 | 1190.1 |
| A | 8 | 15 | 706947 | 589.52 | 5484 | 5381 | 1190.1 |
| B | 10 | 16 | 930738 | 880.74 | 5634 | 5483 | 1050.5 |
| B | 0 | 189 | 277354 | 258.79 | 5634 | 5483 | 1050.5 |
| B | 0 | 205 | 250158 | 232.9 | 5634 | 5483 | 1050.5 |
| C | 3 | 233 | 10147345 | 8468.01 | 5494 | 5429 | 1197.7 |
| C | 10 | 22 | 41212 | 29.88 | 5494 | 5429 | 1197.7 |
| C | 3 | 232 | 36776 | 26.17 | 5494 | 5429 | 1197.7 |
| D | 10 | 199 | 5502437 | 4429.05 | 5423 | 5276 | 1241.2 |
| D | 12 | 110 | 4215120 | 3391.86 | 5423 | 5276 | 1241.2 |
| D | 2 | 152 | 487297 | 388.36 | 5423 | 5276 | 1241.2 |
Histogram calculated using DETX and DETY for each event in the final _common_clean file
| Quadrant A |  |
 |
Quadrant B |
|---|---|---|---|
| Quadrant D |  |
 |
Quadrant C |
| Plot type | Count rate plots | Images |
|---|---|---|
| Comparison with Poisson distribution Blue bars denote a histogram of data divided into 1 sec bins. Red curve is a Poisson curve with rate = median count rate of data. |
 |
 |
| Quadrant-wise count rates Data is divided into 100 sec bins |
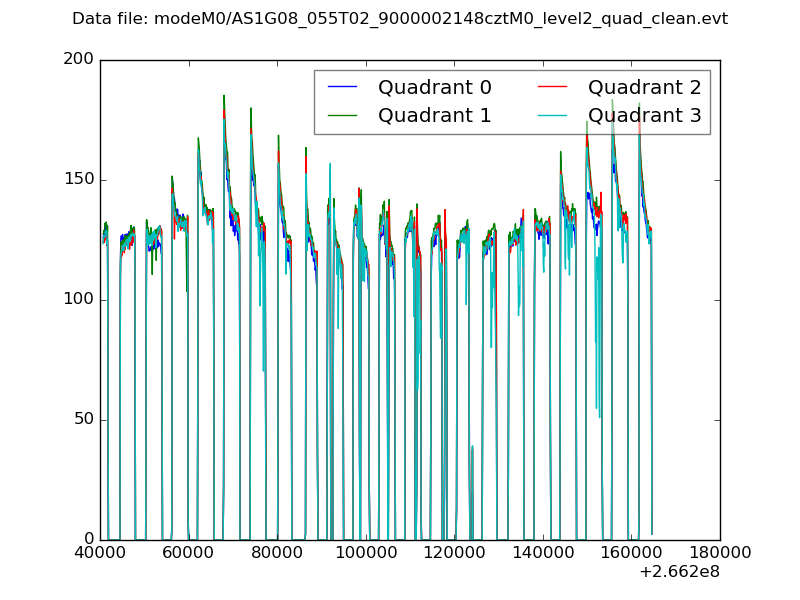 |
|
| Module-wise count rates for Quadrant A Data is divided into 100 sec bins |
 |
 |
| Module-wise count rates for Quadrant B Data is divided into 100 sec bins |
 |
 |
| Module-wise count rates for Quadrant C Data is divided into 100 sec bins |
 |
 |
| Module-wise count rates for Quadrant D Data is divided into 100 sec bins |
 |
 |
| Parameter | Plot |
|---|---|
| CZT HV Monitor |  |
| D_VDD |  |
| Temperature 1 |  |
| Veto HV Monitor |  |
| Veto LLD |  |
| Alpha Counter |  |
| _CPM_Rate | 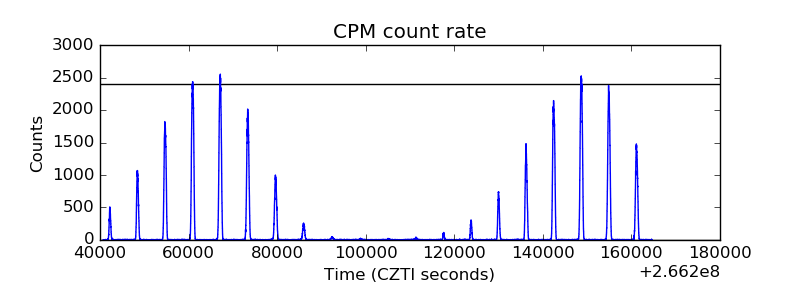 |
| CZT Counter |  |
| +2.5 Volts monitor |  |
| +5 Volts monitor |  |
| _ROLL_ROT |  |
| _Roll_DEC |  |
| _Roll_RA |  |
| Veto Counter |  |