| Param | Original file | Final file |
|---|---|---|
| Filename | modeM0/AS1A04_089T01_9000002146cztM0_level2_bc.evt | modeM0/AS1A04_089T01_9000002146cztM0_level2_quad_clean.evt |
| Size (bytes) | 6,336,648,000 | 1,862,297,280 |
| Size | 5.9 GB | 1.7 GB |
| Events in quadrant A | 65,719,724 | 11,708,818 |
| Events in quadrant B | 35,510,339 | 12,040,423 |
| Events in quadrant C | 42,472,838 | 11,647,736 |
| Events in quadrant D | 38,661,061 | 11,388,898 |
| Mode SS | |||
|---|---|---|---|
| Quadrant | BADHDUFLAG | Total packets | Discarded packets |
| A | 0 | 2864 | 0 |
| B | 0 | 2864 | 0 |
| C | 0 | 2864 | 0 |
| D | 0 | 2864 | 0 |
| Mode M9 | |||
|---|---|---|---|
| Quadrant | BADHDUFLAG | Total packets | Discarded packets |
| A | 0 | 225 | 0 |
| B | 0 | 225 | 0 |
| C | 0 | 225 | 0 |
| D | 0 | 225 | 0 |
| Mode M0 | |||
|---|---|---|---|
| Quadrant | BADHDUFLAG | Total packets | Discarded packets |
| A | 0 | 406483 | 0 |
| B | 0 | 313694 | 0 |
| C | 0 | 337914 | 0 |
| D | 0 | 323532 | 0 |
| Quadrant | Total seconds | Saturated seconds | Saturation percentage |
|---|---|---|---|
| A | 140440 | 5675 | 4.040872% |
| B | 140440 | 3025 | 2.153945% |
| C | 140440 | 1401 | 0.997579% |
| D | 140440 | 3799 | 2.705070% |
Noise dominated data is calculated using 1-second bins in cleaned event files. If a bin has >2000 counts, and if more than 50% of those come from <1% of pixels, then it is considered to be noise-dominated and hence unusable.
| Quadrant | # 1 sec bins | Bins with >0 counts | Bins with >2000 counts | High rate bins dominated by noise | Noise dominated (total time) | Noise dominated (detector-on time) | Marked lightcurve |
|---|---|---|---|---|---|---|---|
| A | 162957 | 140447 | 175 | 175 | 0.11% | 0.12% | 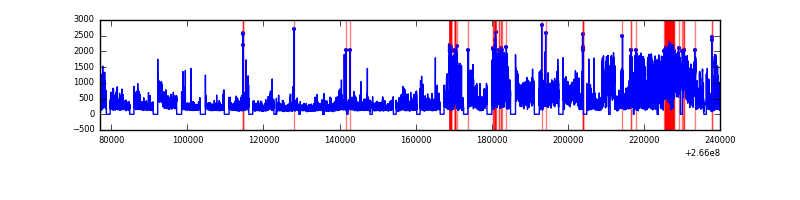 |
| B | 162957 | 140446 | 350 | 350 | 0.21% | 0.25% |  |
| C | 162957 | 140445 | 4 | 4 | 0.00% | 0.00% |  |
| D | 162957 | 140441 | 666 | 666 | 0.41% | 0.47% | 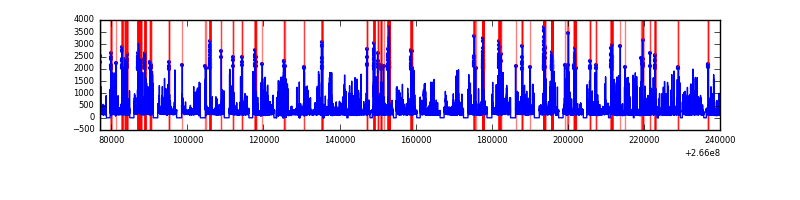 |
Top three noisy pixels from each quadrant. If the there are fewer than three noisy pixels in the level2.evt file, extra rows are filled as -1
| Pixel properties | Quadrant properties | ||||||
|---|---|---|---|---|---|---|---|
| Quadrant | DetID | PixID | Counts | Sigma | Mean | Median | Sigma |
| A | 0 | 23 | 30770267 | 19253.48 | 7377 | 7252 | 1597.8 |
| A | 8 | 15 | 3030257 | 1891.99 | 7377 | 7252 | 1597.8 |
| A | 0 | 226 | 1834096 | 1143.36 | 7377 | 7252 | 1597.8 |
| B | 10 | 16 | 2778301 | 1981.08 | 7496 | 7291 | 1398.7 |
| B | 0 | 189 | 995372 | 706.41 | 7496 | 7291 | 1398.7 |
| B | 0 | 219 | 449243 | 315.96 | 7496 | 7291 | 1398.7 |
| C | 3 | 233 | 13801677 | 8725.33 | 7250 | 7151 | 1581.0 |
| C | 3 | 232 | 66032 | 37.24 | 7250 | 7151 | 1581.0 |
| C | 8 | 128 | 61573 | 34.42 | 7250 | 7151 | 1581.0 |
| D | 10 | 199 | 4507405 | 2359.97 | 7310 | 7107 | 1906.9 |
| D | 12 | 110 | 3190142 | 1669.19 | 7310 | 7107 | 1906.9 |
| D | 1 | 52 | 745838 | 387.39 | 7310 | 7107 | 1906.9 |
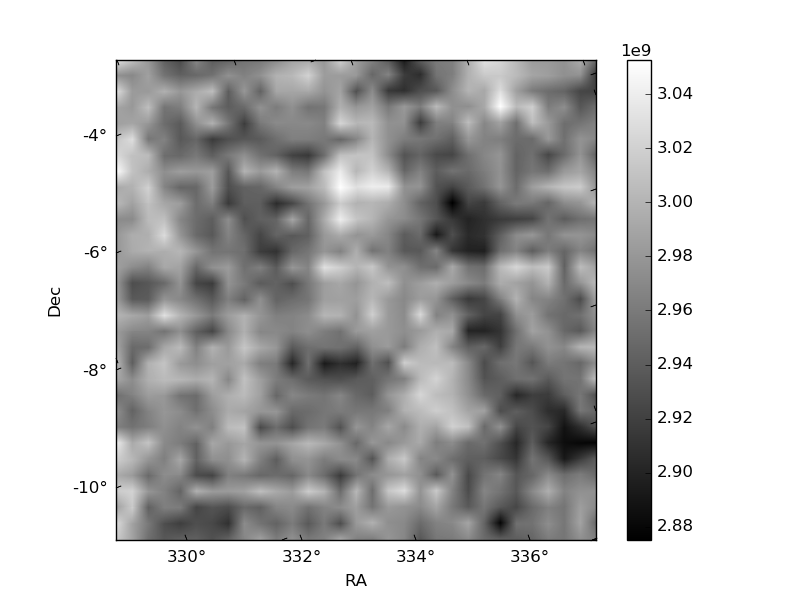
Histogram calculated using DETX and DETY for each event in the final _common_clean file
| Quadrant A |  |
 |
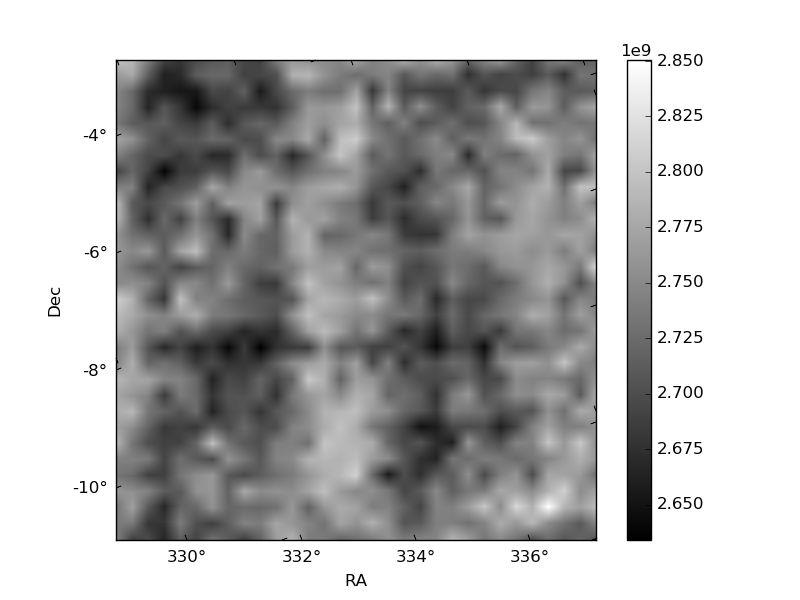
Quadrant B |
|---|---|---|---|
| Quadrant D |  |
 |
Quadrant C |
| Plot type | Count rate plots | Images |
|---|---|---|
| Comparison with Poisson distribution Blue bars denote a histogram of data divided into 1 sec bins. Red curve is a Poisson curve with rate = median count rate of data. |
 |
 |
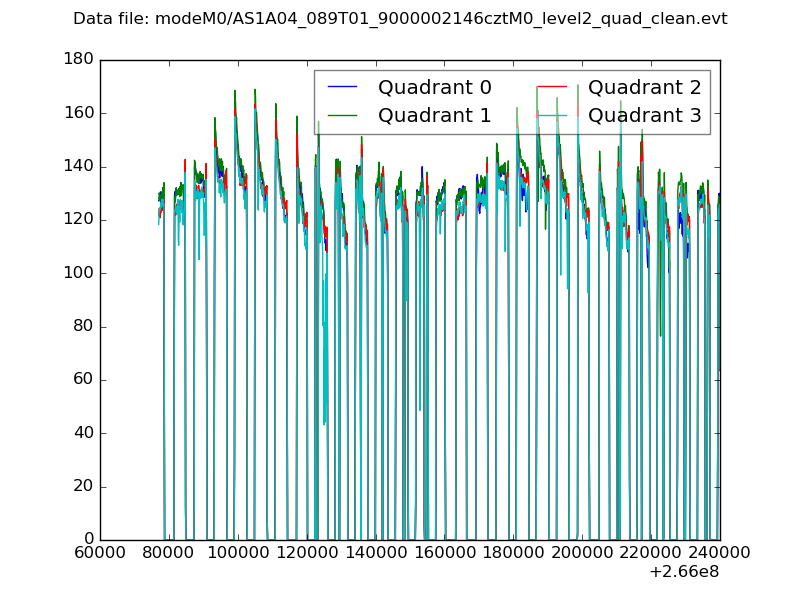
| Quadrant-wise count rates Data is divided into 100 sec bins |
 |
|
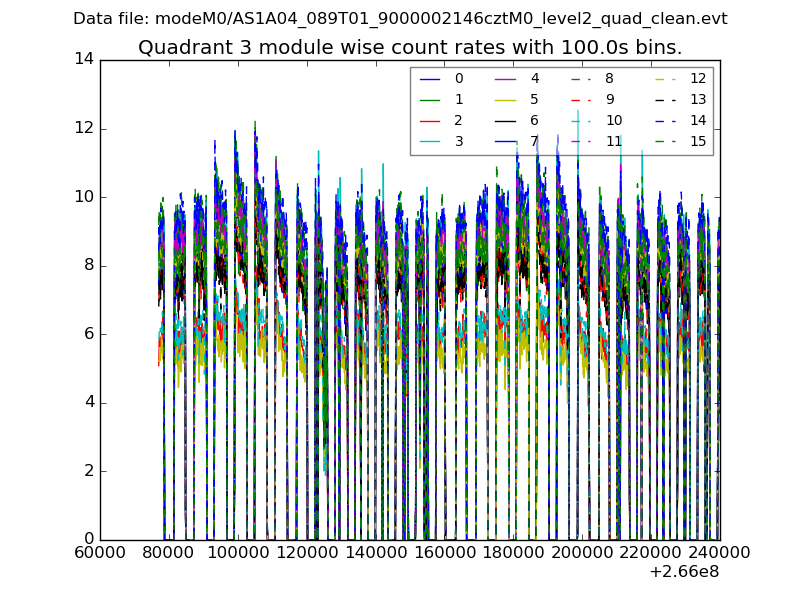
| Module-wise count rates for Quadrant A Data is divided into 100 sec bins |
 |
 |
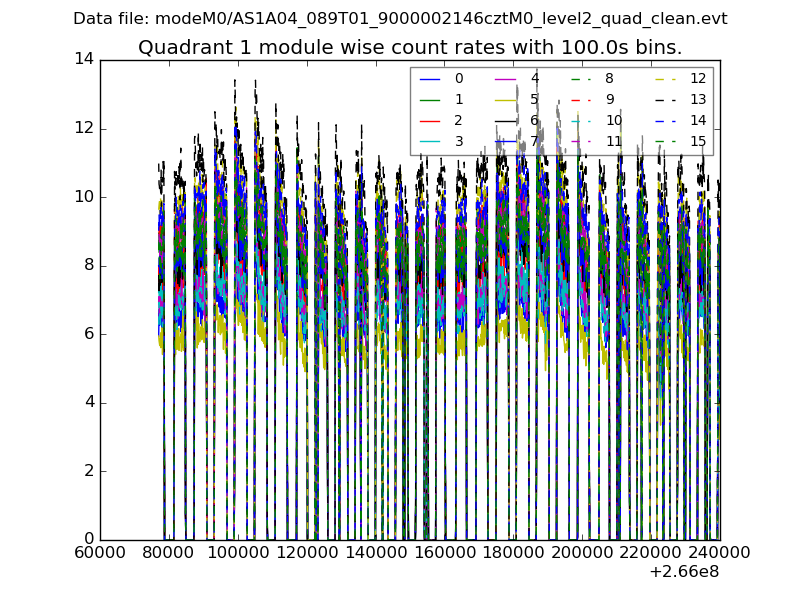
| Module-wise count rates for Quadrant B Data is divided into 100 sec bins |
 |
 |
| Module-wise count rates for Quadrant C Data is divided into 100 sec bins |
 |
 |
| Module-wise count rates for Quadrant D Data is divided into 100 sec bins |
 |
 |
| Parameter | Plot |
|---|---|
| CZT HV Monitor |  |
| D_VDD | 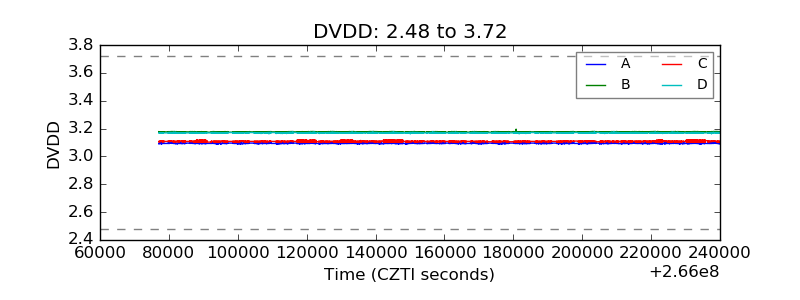 |
| Temperature 1 |  |
| Veto HV Monitor |  |
| Veto LLD | 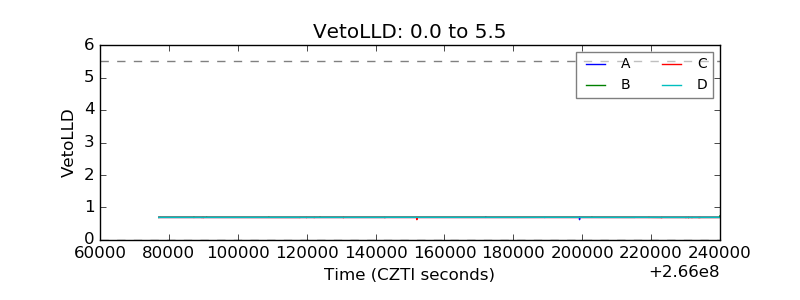 |
| Alpha Counter |  |
| _CPM_Rate | 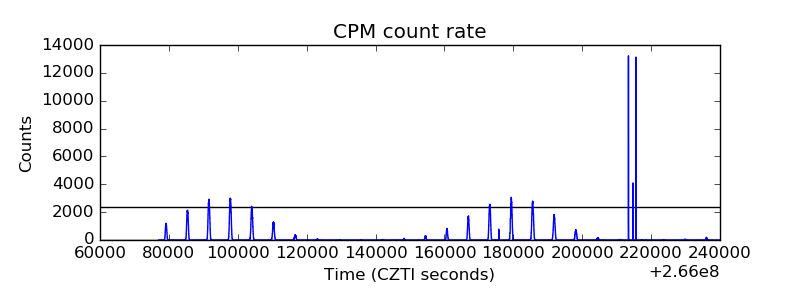 |
| CZT Counter | 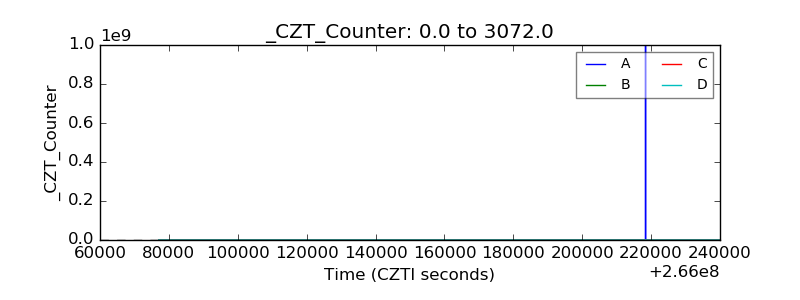 |
| +2.5 Volts monitor |  |
| +5 Volts monitor |  |
| _ROLL_ROT |  |
| _Roll_DEC |  |
| _Roll_RA | 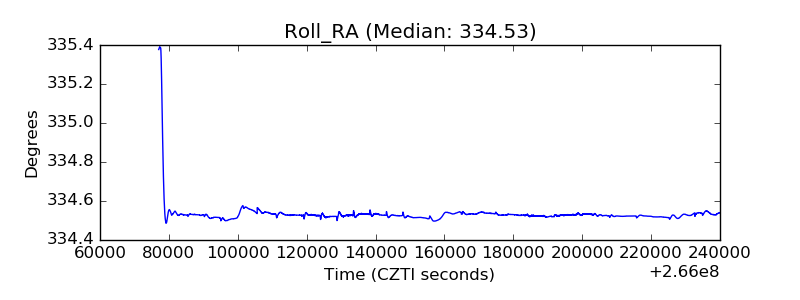 |
| Veto Counter | 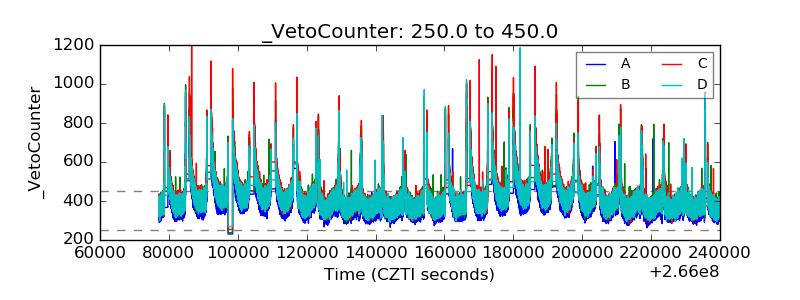 |