| Param | Original file | Final file |
|---|---|---|
| Filename | modeM0/AS1G08_081T01_9000002144cztM0_level2_bc.evt | modeM0/AS1G08_081T01_9000002144cztM0_level2_quad_clean.evt |
| Size (bytes) | 2,913,707,520 | 1,060,519,680 |
| Size | 2.7 GB | 1011.4 MB |
| Events in quadrant A | 20,165,097 | 6,816,301 |
| Events in quadrant B | 18,222,445 | 6,698,244 |
| Events in quadrant C | 20,609,279 | 6,620,080 |
| Events in quadrant D | 23,868,349 | 6,575,806 |
| Mode SS | |||
|---|---|---|---|
| Quadrant | BADHDUFLAG | Total packets | Discarded packets |
| A | 0 | 1612 | 0 |
| B | 0 | 1612 | 0 |
| C | 0 | 1612 | 0 |
| D | 0 | 1612 | 0 |
| Mode M0 | |||
|---|---|---|---|
| Quadrant | BADHDUFLAG | Total packets | Discarded packets |
| A | 0 | 174039 | 0 |
| B | 0 | 171246 | 0 |
| C | 0 | 173510 | 0 |
| D | 0 | 186746 | 0 |
| Mode M9 | |||
|---|---|---|---|
| Quadrant | BADHDUFLAG | Total packets | Discarded packets |
| A | 0 | 126 | 0 |
| B | 0 | 126 | 0 |
| C | 0 | 126 | 0 |
| D | 0 | 126 | 0 |
| Quadrant | Total seconds | Saturated seconds | Saturation percentage |
|---|---|---|---|
| A | 78951 | 1063 | 1.346405% |
| B | 78951 | 1278 | 1.618726% |
| C | 78951 | 778 | 0.985421% |
| D | 78951 | 1611 | 2.040506% |
Noise dominated data is calculated using 1-second bins in cleaned event files. If a bin has >2000 counts, and if more than 50% of those come from <1% of pixels, then it is considered to be noise-dominated and hence unusable.
| Quadrant | # 1 sec bins | Bins with >0 counts | Bins with >2000 counts | High rate bins dominated by noise | Noise dominated (total time) | Noise dominated (detector-on time) | Marked lightcurve |
|---|---|---|---|---|---|---|---|
| A | 91632 | 78954 | 3 | 3 | 0.00% | 0.00% |  |
| B | 91632 | 78952 | 23 | 23 | 0.03% | 0.03% |  |
| C | 91632 | 78953 | 5 | 5 | 0.01% | 0.01% |  |
| D | 91632 | 78951 | 269 | 269 | 0.29% | 0.34% |  |
Top three noisy pixels from each quadrant. If the there are fewer than three noisy pixels in the level2.evt file, extra rows are filled as -1
| Pixel properties | Quadrant properties | ||||||
|---|---|---|---|---|---|---|---|
| Quadrant | DetID | PixID | Counts | Sigma | Mean | Median | Sigma |
| A | 8 | 15 | 2571245 | 2862.52 | 4148 | 4066 | 896.8 |
| A | 0 | 23 | 807566 | 895.94 | 4148 | 4066 | 896.8 |
| A | 12 | 189 | 571806 | 633.06 | 4148 | 4066 | 896.8 |
| B | 0 | 189 | 698420 | 903.95 | 4125 | 4021 | 768.2 |
| B | 0 | 219 | 213368 | 272.52 | 4125 | 4021 | 768.2 |
| B | 0 | 229 | 211618 | 270.24 | 4125 | 4021 | 768.2 |
| C | 3 | 233 | 4710499 | 5344.57 | 4020 | 3969 | 880.6 |
| C | 6 | 96 | 80097 | 86.45 | 4020 | 3969 | 880.6 |
| C | 8 | 128 | 37182 | 37.72 | 4020 | 3969 | 880.6 |
| D | 12 | 110 | 5140018 | 5264.38 | 4098 | 3961 | 975.6 |
| D | 10 | 199 | 1456723 | 1489.06 | 4098 | 3961 | 975.6 |
| D | 2 | 152 | 781366 | 796.83 | 4098 | 3961 | 975.6 |
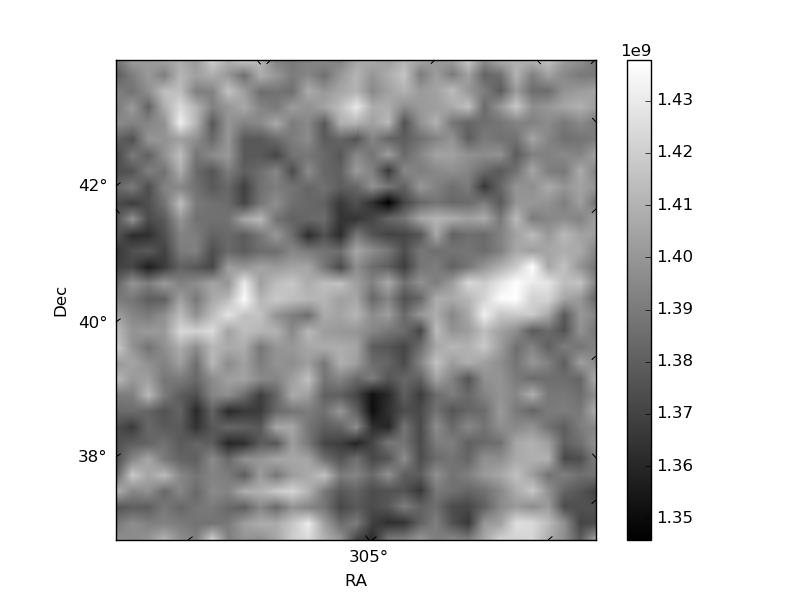
Histogram calculated using DETX and DETY for each event in the final _common_clean file
| Quadrant A |  |
 |
Quadrant B |
|---|---|---|---|
| Quadrant D |  |
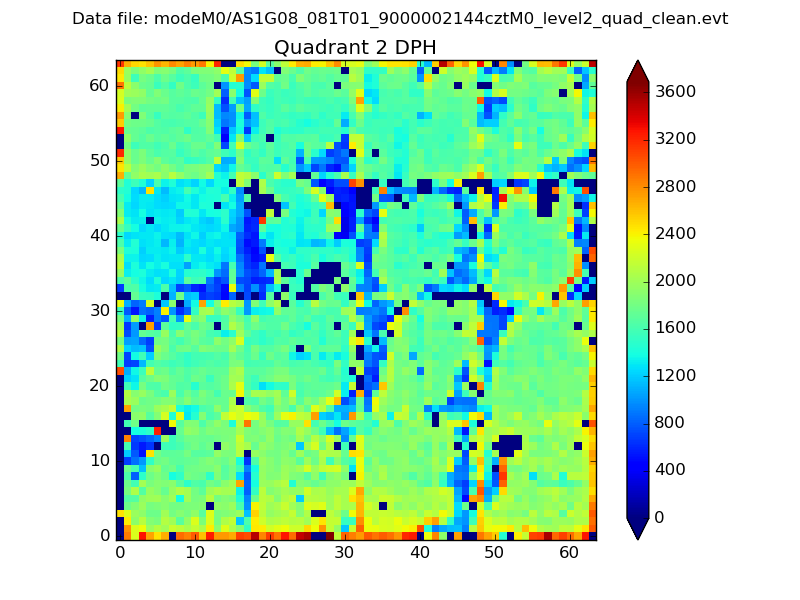 |
Quadrant C |
| Plot type | Count rate plots | Images |
|---|---|---|
| Comparison with Poisson distribution Blue bars denote a histogram of data divided into 1 sec bins. Red curve is a Poisson curve with rate = median count rate of data. |
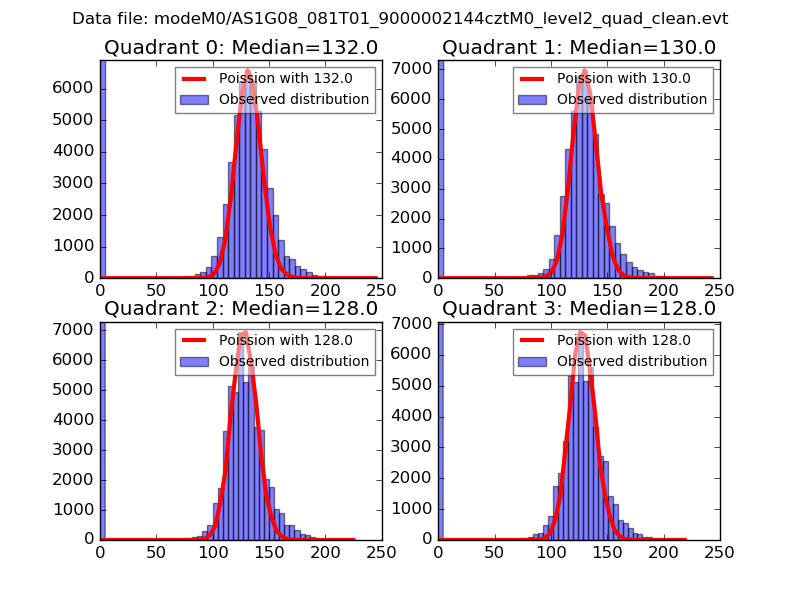 |
 |
| Quadrant-wise count rates Data is divided into 100 sec bins |
 |
|
| Module-wise count rates for Quadrant A Data is divided into 100 sec bins |
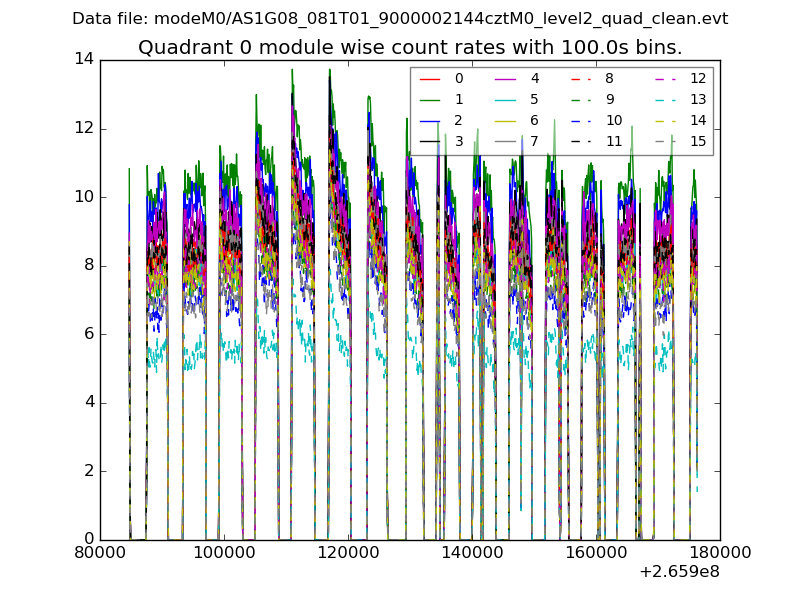 |
 |
| Module-wise count rates for Quadrant B Data is divided into 100 sec bins |
 |
 |
| Module-wise count rates for Quadrant C Data is divided into 100 sec bins |
 |
 |
| Module-wise count rates for Quadrant D Data is divided into 100 sec bins |
 |
 |
| Parameter | Plot |
|---|---|
| CZT HV Monitor |  |
| D_VDD |  |
| Temperature 1 | 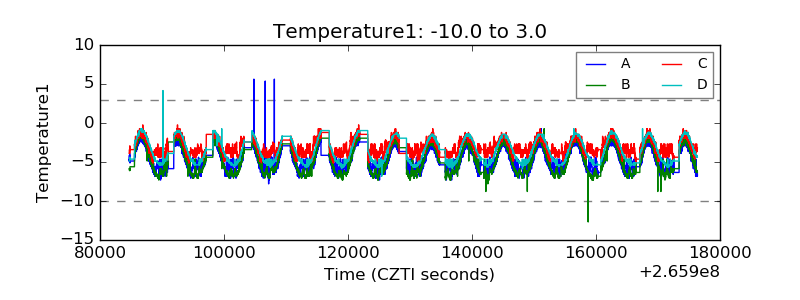 |
| Veto HV Monitor |  |
| Veto LLD |  |
| Alpha Counter |  |
| _CPM_Rate | 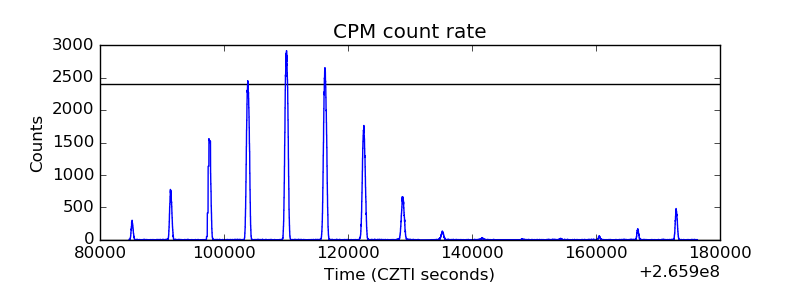 |
| CZT Counter | 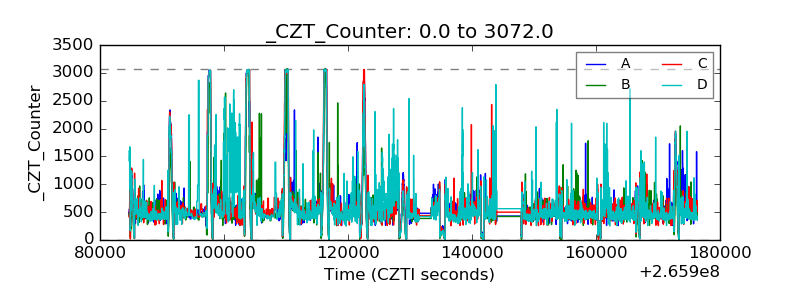 |
| +2.5 Volts monitor |  |
| +5 Volts monitor |  |
| _ROLL_ROT |  |
| _Roll_DEC |  |
| _Roll_RA |  |
| Veto Counter |  |