| Param | Original file | Final file |
|---|---|---|
| Filename | modeM0/AS1T02_049T01_9000002142cztM0_level2_bc.evt | modeM0/AS1T02_049T01_9000002142cztM0_level2_quad_clean.evt |
| Size (bytes) | 2,619,138,240 | 1,119,306,240 |
| Size | 2.4 GB | 1.0 GB |
| Events in quadrant A | 21,678,589 | 7,341,668 |
| Events in quadrant B | 16,106,903 | 7,458,523 |
| Events in quadrant C | 16,796,149 | 7,444,724 |
| Events in quadrant D | 20,248,081 | 7,136,969 |
| Mode SS | |||
|---|---|---|---|
| Quadrant | BADHDUFLAG | Total packets | Discarded packets |
| A | 0 | 1350 | 0 |
| B | 0 | 1350 | 0 |
| C | 0 | 1350 | 0 |
| D | 0 | 1350 | 0 |
| Mode M0 | |||
|---|---|---|---|
| Quadrant | BADHDUFLAG | Total packets | Discarded packets |
| A | 0 | 160723 | 0 |
| B | 0 | 143353 | 0 |
| C | 0 | 142872 | 0 |
| D | 0 | 155954 | 0 |
| Mode M9 | |||
|---|---|---|---|
| Quadrant | BADHDUFLAG | Total packets | Discarded packets |
| A | 0 | 101 | 0 |
| B | 0 | 101 | 0 |
| C | 0 | 101 | 0 |
| D | 0 | 101 | 0 |
| Quadrant | Total seconds | Saturated seconds | Saturation percentage |
|---|---|---|---|
| A | 65945 | 1528 | 2.317082% |
| B | 65945 | 864 | 1.310183% |
| C | 65945 | 533 | 0.808249% |
| D | 65945 | 1512 | 2.292820% |
Noise dominated data is calculated using 1-second bins in cleaned event files. If a bin has >2000 counts, and if more than 50% of those come from <1% of pixels, then it is considered to be noise-dominated and hence unusable.
| Quadrant | # 1 sec bins | Bins with >0 counts | Bins with >2000 counts | High rate bins dominated by noise | Noise dominated (total time) | Noise dominated (detector-on time) | Marked lightcurve |
|---|---|---|---|---|---|---|---|
| A | 76381 | 65948 | 43 | 43 | 0.06% | 0.07% |  |
| B | 76381 | 65945 | 16 | 16 | 0.02% | 0.02% | 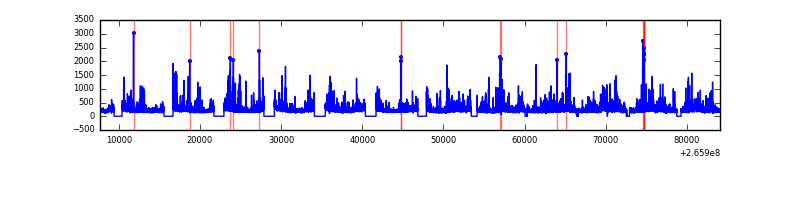 |
| C | 76381 | 65947 | 3 | 3 | 0.00% | 0.00% |  |
| D | 76381 | 65946 | 439 | 439 | 0.57% | 0.67% | 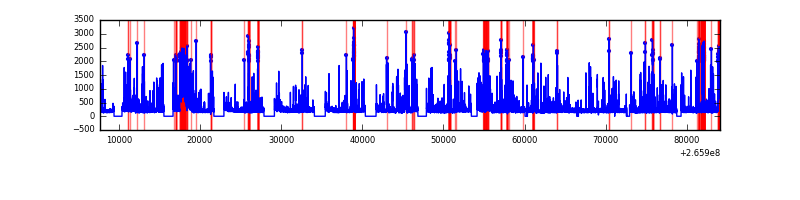 |
Top three noisy pixels from each quadrant. If the there are fewer than three noisy pixels in the level2.evt file, extra rows are filled as -1
| Pixel properties | Quadrant properties | ||||||
|---|---|---|---|---|---|---|---|
| Quadrant | DetID | PixID | Counts | Sigma | Mean | Median | Sigma |
| A | 8 | 15 | 7864570 | 10749.52 | 3337 | 3279 | 731.3 |
| A | 12 | 189 | 465049 | 631.42 | 3337 | 3279 | 731.3 |
| A | 0 | 23 | 341711 | 462.77 | 3337 | 3279 | 731.3 |
| B | 3 | 209 | 611260 | 961.65 | 3389 | 3306 | 632.2 |
| B | 0 | 189 | 459809 | 722.09 | 3389 | 3306 | 632.2 |
| B | 0 | 219 | 427414 | 670.85 | 3389 | 3306 | 632.2 |
| C | 3 | 233 | 3658378 | 4964.34 | 3330 | 3295 | 736.3 |
| C | 10 | 22 | 34862 | 42.87 | 3330 | 3295 | 736.3 |
| C | 0 | 207 | 32846 | 40.14 | 3330 | 3295 | 736.3 |
| D | 12 | 110 | 4790759 | 5778.57 | 3324 | 3213 | 828.5 |
| D | 10 | 199 | 1035210 | 1245.62 | 3324 | 3213 | 828.5 |
| D | 2 | 234 | 277797 | 331.42 | 3324 | 3213 | 828.5 |
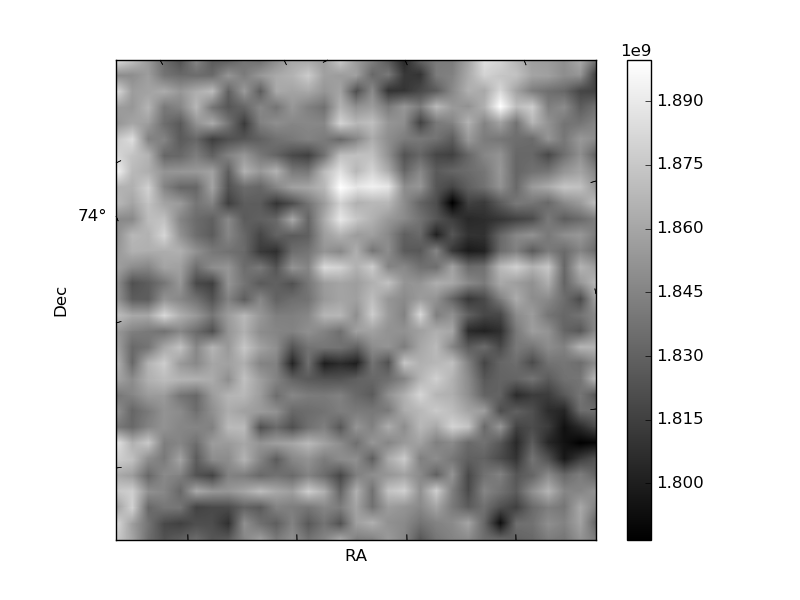
Histogram calculated using DETX and DETY for each event in the final _common_clean file
| Quadrant A | 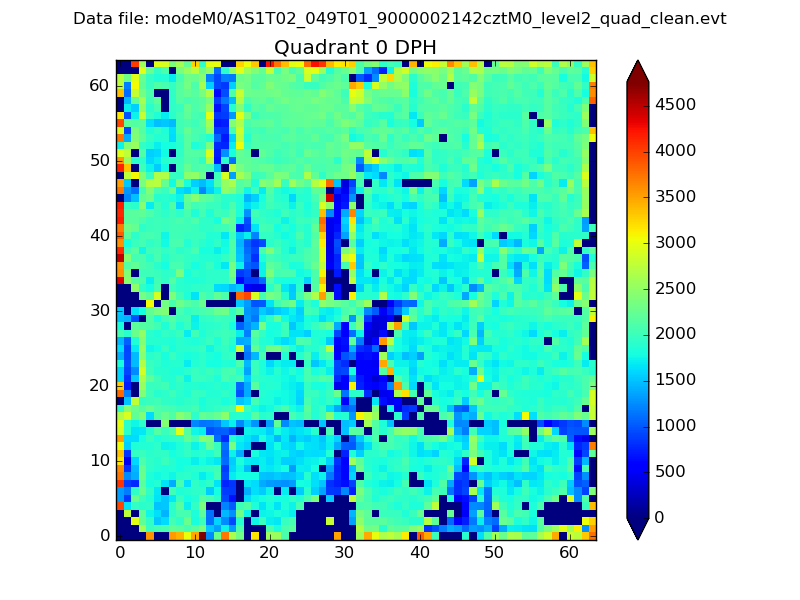 |
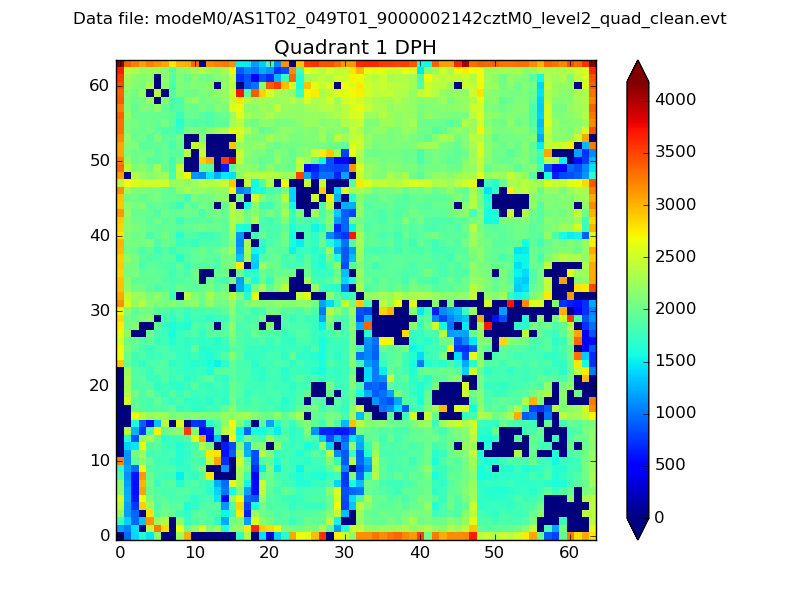 |
Quadrant B |
|---|---|---|---|
| Quadrant D | 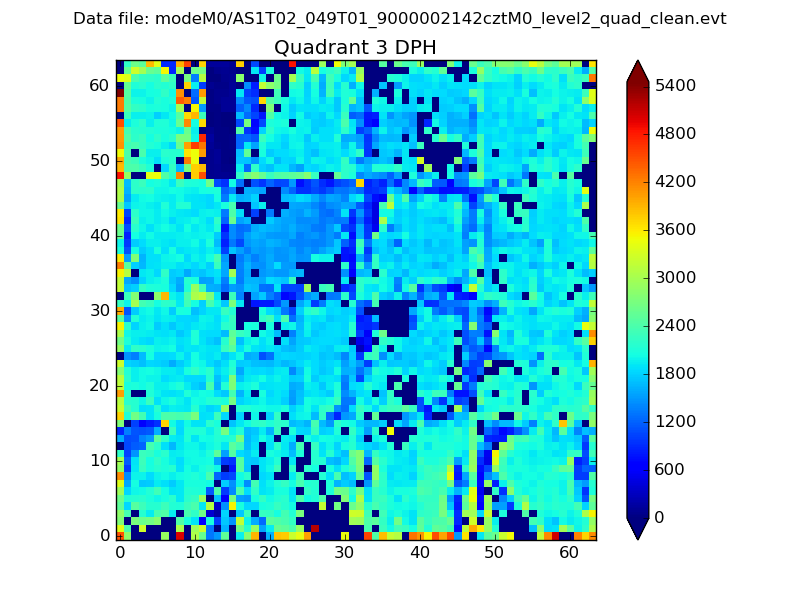 |
 |
Quadrant C |
| Plot type | Count rate plots | Images |
|---|---|---|
| Comparison with Poisson distribution Blue bars denote a histogram of data divided into 1 sec bins. Red curve is a Poisson curve with rate = median count rate of data. |
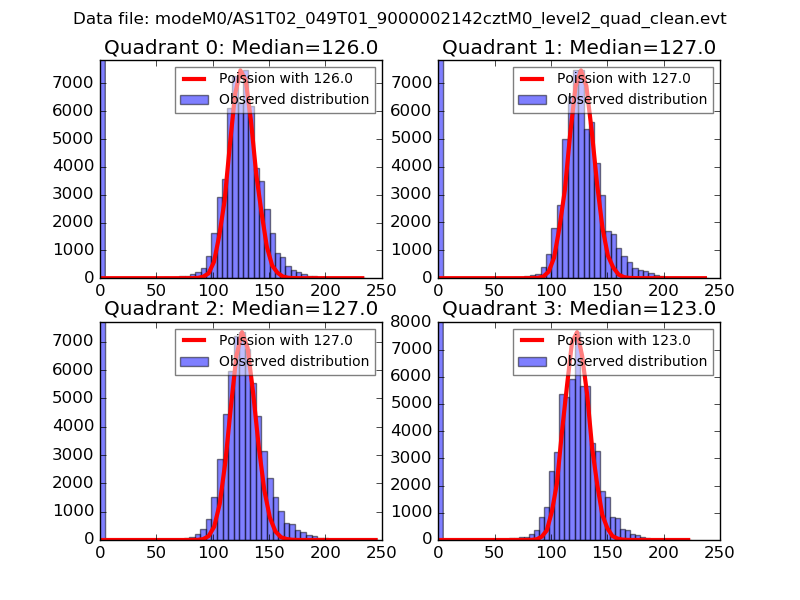 |
 |
| Quadrant-wise count rates Data is divided into 100 sec bins |
 |
|
| Module-wise count rates for Quadrant A Data is divided into 100 sec bins |
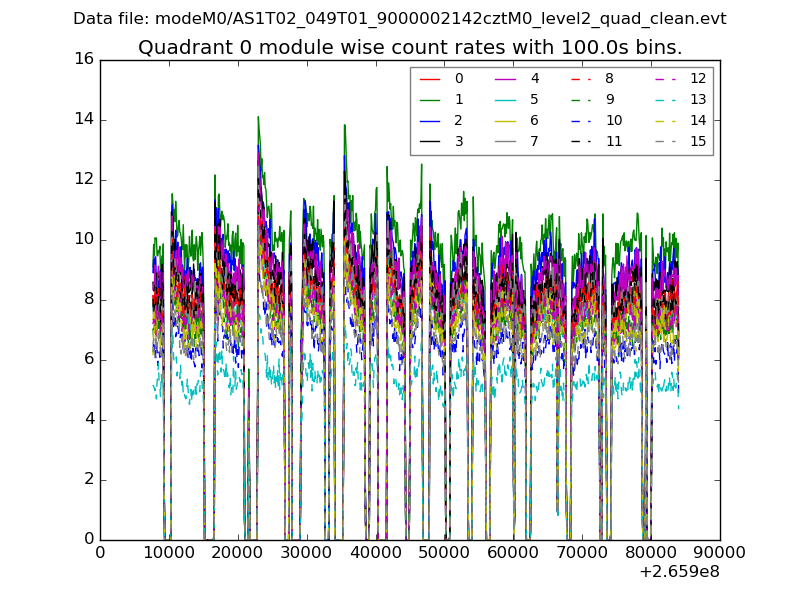 |
 |
| Module-wise count rates for Quadrant B Data is divided into 100 sec bins |
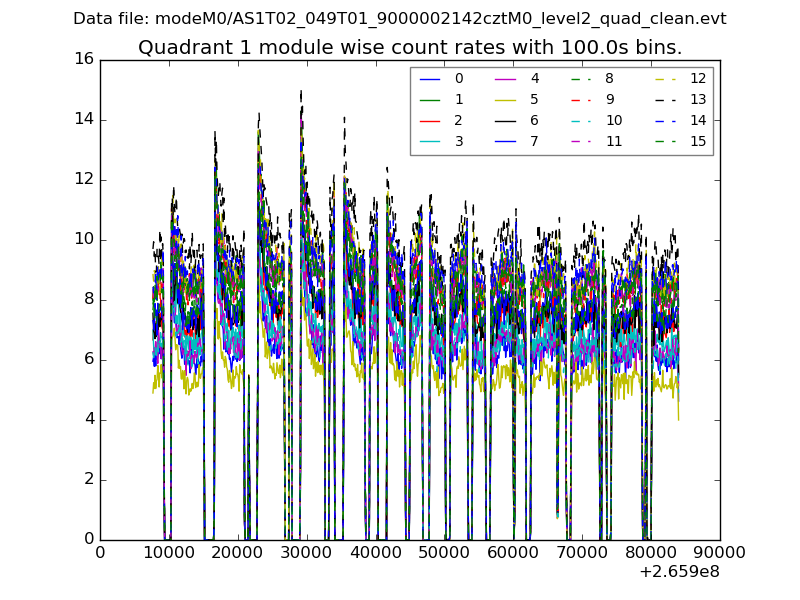 |
 |
| Module-wise count rates for Quadrant C Data is divided into 100 sec bins |
 |
 |
| Module-wise count rates for Quadrant D Data is divided into 100 sec bins |
 |
 |
| Parameter | Plot |
|---|---|
| CZT HV Monitor |  |
| D_VDD |  |
| Temperature 1 |  |
| Veto HV Monitor | 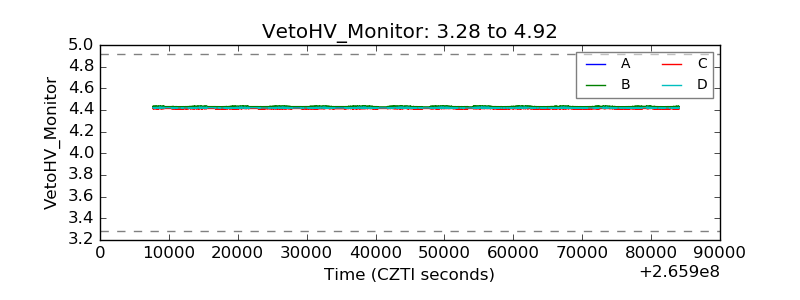 |
| Veto LLD | 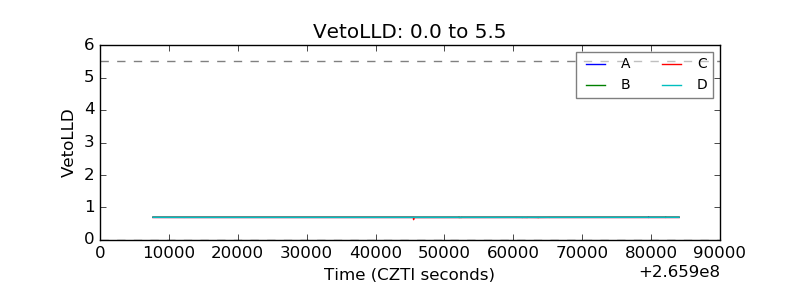 |
| Alpha Counter |  |
| _CPM_Rate |  |
| CZT Counter |  |
| +2.5 Volts monitor |  |
| +5 Volts monitor |  |
| _ROLL_ROT | 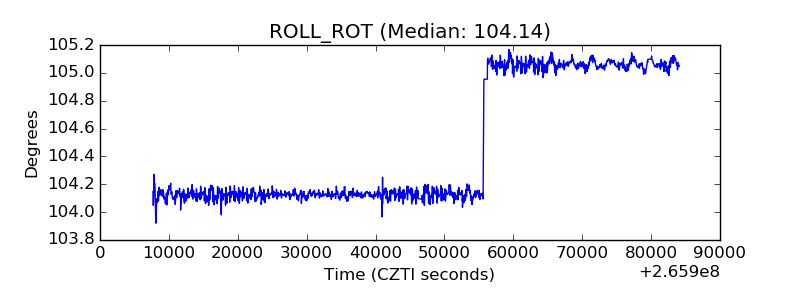 |
| _Roll_DEC |  |
| _Roll_RA |  |
| Veto Counter |  |