| Param | Original file | Final file |
|---|---|---|
| Filename | modeM0/AS1G08_034T02_9000002136cztM0_level2_bc.evt | modeM0/AS1G08_034T02_9000002136cztM0_level2_quad_clean.evt |
| Size (bytes) | 1,888,937,280 | 731,053,440 |
| Size | 1.8 GB | 697.2 MB |
| Events in quadrant A | 12,323,155 | 4,644,797 |
| Events in quadrant B | 13,869,294 | 4,709,374 |
| Events in quadrant C | 12,925,878 | 4,648,997 |
| Events in quadrant D | 14,459,361 | 4,489,213 |
| Mode M0 | |||
|---|---|---|---|
| Quadrant | BADHDUFLAG | Total packets | Discarded packets |
| A | 0 | 117240 | 0 |
| B | 0 | 121205 | 0 |
| C | 0 | 114184 | 0 |
| D | 0 | 125849 | 0 |
| Mode SS | |||
|---|---|---|---|
| Quadrant | BADHDUFLAG | Total packets | Discarded packets |
| A | 0 | 1088 | 0 |
| B | 0 | 1088 | 0 |
| C | 0 | 1088 | 0 |
| D | 0 | 1088 | 0 |
| Mode M9 | |||
|---|---|---|---|
| Quadrant | BADHDUFLAG | Total packets | Discarded packets |
| A | 0 | 95 | 0 |
| B | 0 | 95 | 0 |
| C | 0 | 95 | 0 |
| D | 0 | 95 | 0 |
| Quadrant | Total seconds | Saturated seconds | Saturation percentage |
|---|---|---|---|
| A | 53207 | 1254 | 2.356833% |
| B | 53207 | 1056 | 1.984701% |
| C | 53207 | 473 | 0.888981% |
| D | 53207 | 1769 | 3.324751% |
Noise dominated data is calculated using 1-second bins in cleaned event files. If a bin has >2000 counts, and if more than 50% of those come from <1% of pixels, then it is considered to be noise-dominated and hence unusable.
| Quadrant | # 1 sec bins | Bins with >0 counts | Bins with >2000 counts | High rate bins dominated by noise | Noise dominated (total time) | Noise dominated (detector-on time) | Marked lightcurve |
|---|---|---|---|---|---|---|---|
| A | 80942 | 53208 | 9 | 9 | 0.01% | 0.02% |  |
| B | 80942 | 53211 | 27 | 27 | 0.03% | 0.05% |  |
| C | 80942 | 53208 | 3 | 3 | 0.00% | 0.01% | 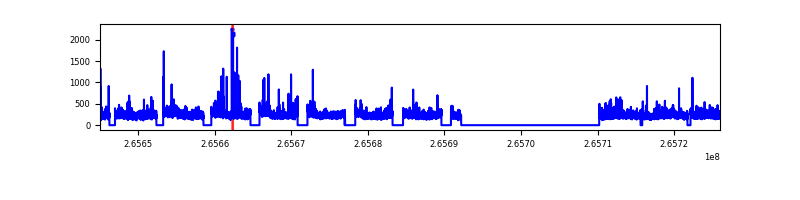 |
| D | 80942 | 53210 | 57 | 57 | 0.07% | 0.11% |  |
Top three noisy pixels from each quadrant. If the there are fewer than three noisy pixels in the level2.evt file, extra rows are filled as -1
| Pixel properties | Quadrant properties | ||||||
|---|---|---|---|---|---|---|---|
| Quadrant | DetID | PixID | Counts | Sigma | Mean | Median | Sigma |
| A | 12 | 189 | 572544 | 929.83 | 2791 | 2736 | 612.8 |
| A | 4 | 2 | 262943 | 424.61 | 2791 | 2736 | 612.8 |
| A | 0 | 23 | 250356 | 404.07 | 2791 | 2736 | 612.8 |
| B | 10 | 245 | 568658 | 1067.29 | 2820 | 2745 | 530.2 |
| B | 0 | 189 | 490406 | 919.71 | 2820 | 2745 | 530.2 |
| B | 15 | 222 | 380398 | 712.24 | 2820 | 2745 | 530.2 |
| C | 3 | 233 | 1619491 | 2697.16 | 2748 | 2713 | 599.4 |
| C | 0 | 207 | 509445 | 845.35 | 2748 | 2713 | 599.4 |
| C | 8 | 128 | 20309 | 29.35 | 2748 | 2713 | 599.4 |
| D | 10 | 199 | 1247301 | 1924.1 | 2737 | 2655 | 646.9 |
| D | 2 | 120 | 1226832 | 1892.46 | 2737 | 2655 | 646.9 |
| D | 12 | 110 | 743015 | 1144.52 | 2737 | 2655 | 646.9 |
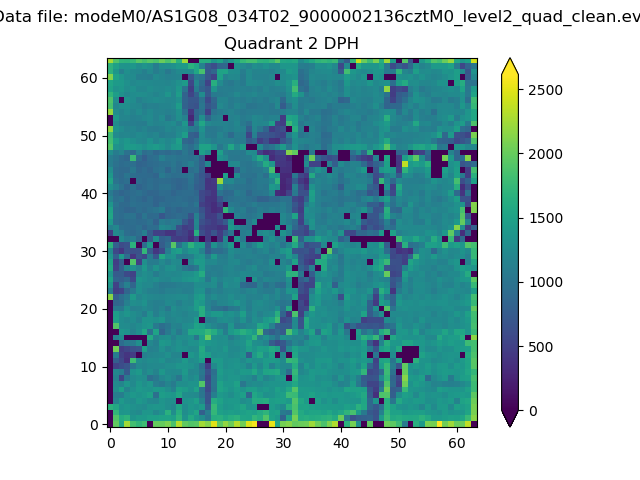
Histogram calculated using DETX and DETY for each event in the final _common_clean file
| Quadrant A |  |
 |
Quadrant B |
|---|---|---|---|
| Quadrant D | 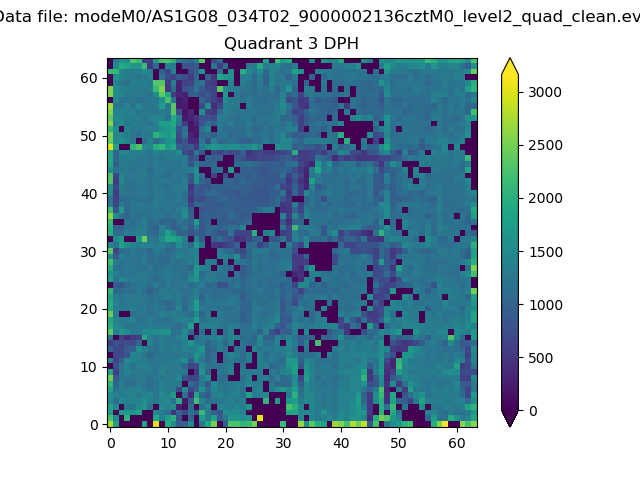 |
 |
Quadrant C |
| Plot type | Count rate plots | Images |
|---|---|---|
| Comparison with Poisson distribution Blue bars denote a histogram of data divided into 1 sec bins. Red curve is a Poisson curve with rate = median count rate of data. |
 |
 |
| Quadrant-wise count rates Data is divided into 100 sec bins |
 |
|
| Module-wise count rates for Quadrant A Data is divided into 100 sec bins |
 |
 |
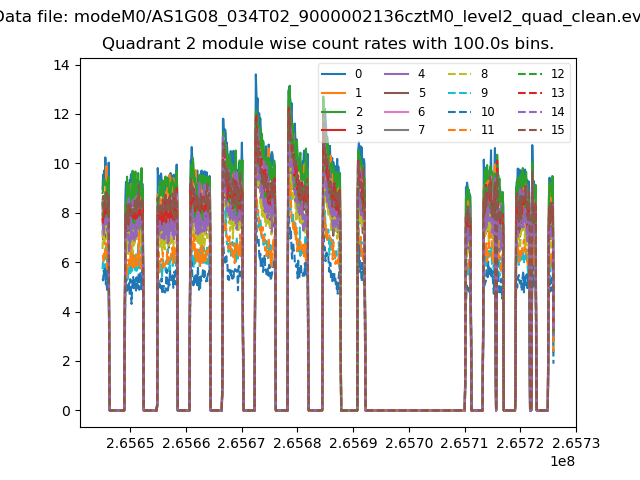
| Module-wise count rates for Quadrant B Data is divided into 100 sec bins |
 |
 |
| Module-wise count rates for Quadrant C Data is divided into 100 sec bins |
 |
 |
| Module-wise count rates for Quadrant D Data is divided into 100 sec bins |
 |
 |
| Parameter | Plot |
|---|---|
| CZT HV Monitor |  |
| D_VDD |  |
| Temperature 1 |  |
| Veto HV Monitor |  |
| Veto LLD |  |
| Alpha Counter |  |
| _CPM_Rate |  |
| CZT Counter |  |
| +2.5 Volts monitor |  |
| +5 Volts monitor |  |
| _ROLL_ROT |  |
| _Roll_DEC |  |
| _Roll_RA |  |
| Veto Counter |  |