| Param | Original file | Final file |
|---|---|---|
| Filename | modeM0/AS1G08_083T01_9000002134cztM0_level2_bc.evt | modeM0/AS1G08_083T01_9000002134cztM0_level2_quad_clean.evt |
| Size (bytes) | 1,589,676,480 | 653,169,600 |
| Size | 1.5 GB | 622.9 MB |
| Events in quadrant A | 9,968,961 | 4,207,543 |
| Events in quadrant B | 10,966,147 | 4,203,773 |
| Events in quadrant C | 10,647,564 | 4,170,059 |
| Events in quadrant D | 13,373,665 | 3,998,030 |
| Mode SS | |||
|---|---|---|---|
| Quadrant | BADHDUFLAG | Total packets | Discarded packets |
| A | 0 | 956 | 0 |
| B | 0 | 956 | 0 |
| C | 0 | 956 | 0 |
| D | 0 | 956 | 0 |
| Mode M9 | |||
|---|---|---|---|
| Quadrant | BADHDUFLAG | Total packets | Discarded packets |
| A | 0 | 53 | 0 |
| B | 0 | 53 | 0 |
| C | 0 | 53 | 0 |
| D | 0 | 53 | 0 |
| Mode M0 | |||
|---|---|---|---|
| Quadrant | BADHDUFLAG | Total packets | Discarded packets |
| A | 0 | 98025 | 0 |
| B | 0 | 100961 | 0 |
| C | 0 | 96824 | 0 |
| D | 0 | 110990 | 0 |
| Quadrant | Total seconds | Saturated seconds | Saturation percentage |
|---|---|---|---|
| A | 46684 | 1093 | 2.341273% |
| B | 46684 | 1009 | 2.161340% |
| C | 46684 | 662 | 1.418045% |
| D | 46684 | 1694 | 3.628652% |
Noise dominated data is calculated using 1-second bins in cleaned event files. If a bin has >2000 counts, and if more than 50% of those come from <1% of pixels, then it is considered to be noise-dominated and hence unusable.
| Quadrant | # 1 sec bins | Bins with >0 counts | Bins with >2000 counts | High rate bins dominated by noise | Noise dominated (total time) | Noise dominated (detector-on time) | Marked lightcurve |
|---|---|---|---|---|---|---|---|
| A | 52206 | 46686 | 11 | 11 | 0.02% | 0.02% | 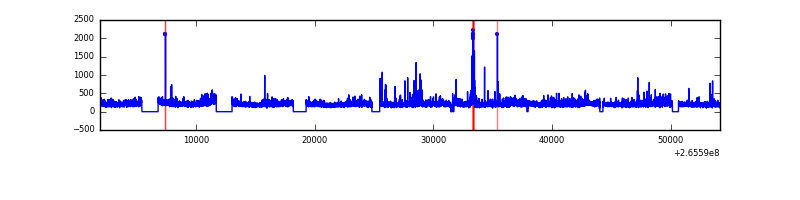 |
| B | 52206 | 46686 | 8 | 8 | 0.02% | 0.02% |  |
| C | 52206 | 46688 | 1 | 1 | 0.00% | 0.00% |  |
| D | 52206 | 46683 | 143 | 143 | 0.27% | 0.31% |  |
Top three noisy pixels from each quadrant. If the there are fewer than three noisy pixels in the level2.evt file, extra rows are filled as -1
| Pixel properties | Quadrant properties | ||||||
|---|---|---|---|---|---|---|---|
| Quadrant | DetID | PixID | Counts | Sigma | Mean | Median | Sigma |
| A | 12 | 189 | 498389 | 951.61 | 2344 | 2294 | 521.3 |
| A | 14 | 111 | 346496 | 660.25 | 2344 | 2294 | 521.3 |
| A | 8 | 15 | 33099 | 59.09 | 2344 | 2294 | 521.3 |
| B | 0 | 189 | 404417 | 900.09 | 2364 | 2303 | 446.8 |
| B | 3 | 209 | 291561 | 647.47 | 2364 | 2303 | 446.8 |
| B | 15 | 222 | 275150 | 610.74 | 2364 | 2303 | 446.8 |
| C | 3 | 233 | 1233576 | 2382.3 | 2318 | 2290 | 516.8 |
| C | 0 | 207 | 281999 | 541.18 | 2318 | 2290 | 516.8 |
| C | 7 | 247 | 44363 | 81.4 | 2318 | 2290 | 516.8 |
| D | 2 | 120 | 1446098 | 2678.07 | 2280 | 2213 | 539.2 |
| D | 12 | 110 | 1164906 | 2156.52 | 2280 | 2213 | 539.2 |
| D | 10 | 199 | 644859 | 1191.96 | 2280 | 2213 | 539.2 |
Histogram calculated using DETX and DETY for each event in the final _common_clean file
| Quadrant A |  |
 |
Quadrant B |
|---|---|---|---|
| Quadrant D |  |
 |
Quadrant C |
| Plot type | Count rate plots | Images |
|---|---|---|
| Comparison with Poisson distribution Blue bars denote a histogram of data divided into 1 sec bins. Red curve is a Poisson curve with rate = median count rate of data. |
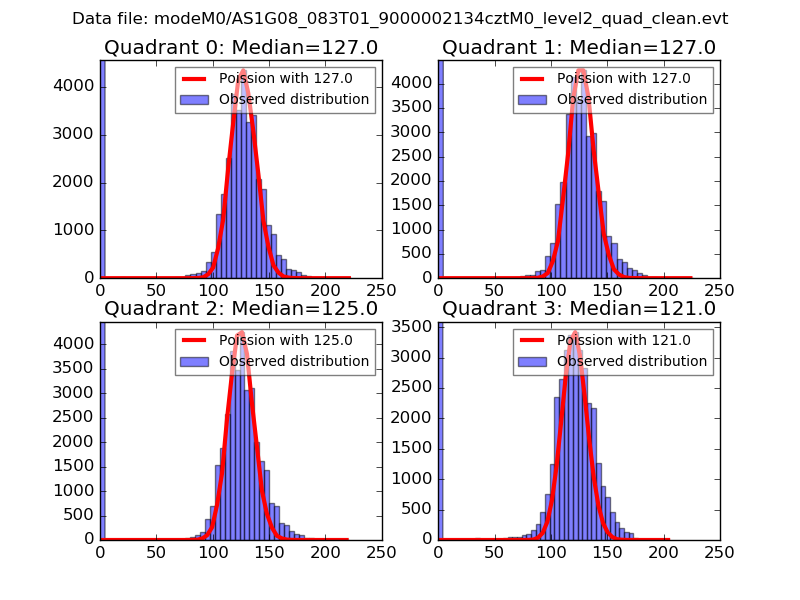 |
 |
| Quadrant-wise count rates Data is divided into 100 sec bins |
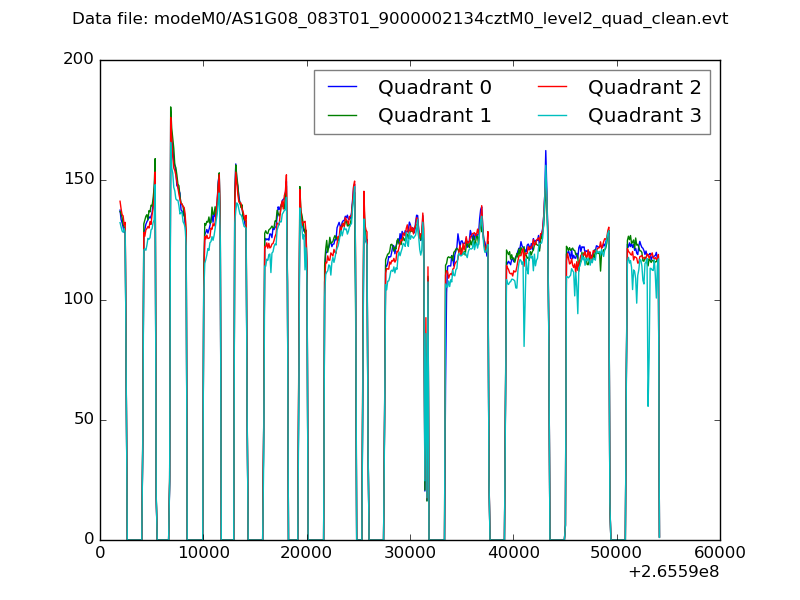 |
|
| Module-wise count rates for Quadrant A Data is divided into 100 sec bins |
 |
 |
| Module-wise count rates for Quadrant B Data is divided into 100 sec bins |
 |
 |
| Module-wise count rates for Quadrant C Data is divided into 100 sec bins |
 |
 |
| Module-wise count rates for Quadrant D Data is divided into 100 sec bins |
 |
 |
| Parameter | Plot |
|---|---|
| CZT HV Monitor | 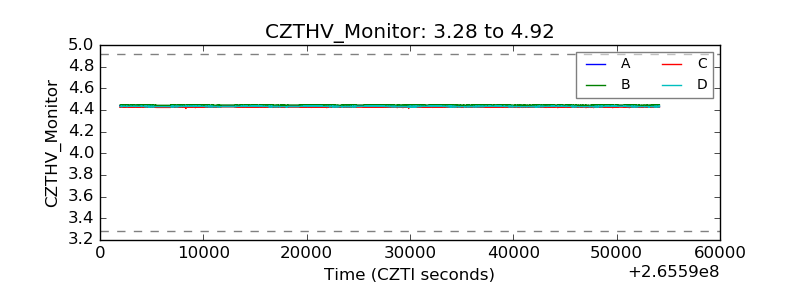 |
| D_VDD |  |
| Temperature 1 |  |
| Veto HV Monitor |  |
| Veto LLD | 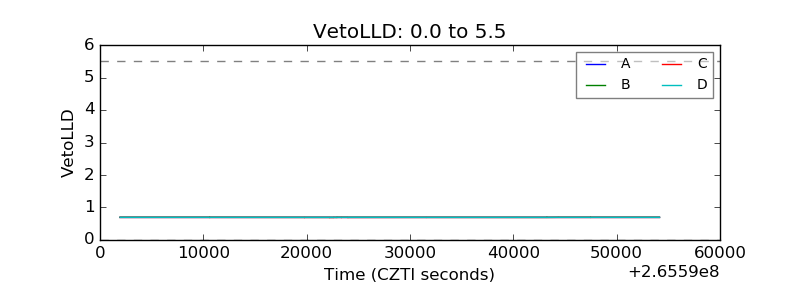 |
| Alpha Counter |  |
| _CPM_Rate |  |
| CZT Counter |  |
| +2.5 Volts monitor |  |
| +5 Volts monitor |  |
| _ROLL_ROT |  |
| _Roll_DEC |  |
| _Roll_RA | 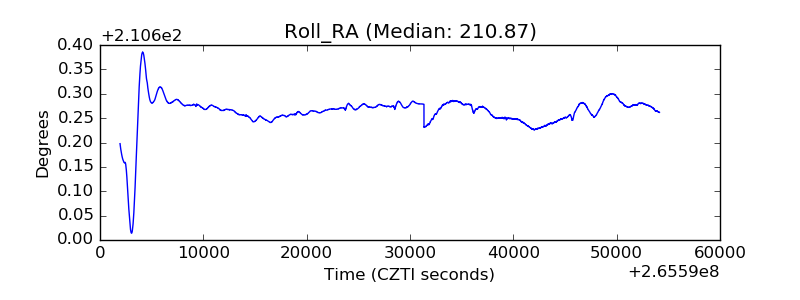 |
| Veto Counter |  |