| Param | Original file | Final file |
|---|---|---|
| Filename | modeM0/AS1G08_025T01_9000002130cztM0_level2_bc.evt | modeM0/AS1G08_025T01_9000002130cztM0_level2_quad_clean.evt |
| Size (bytes) | 9,583,041,600 | 3,197,436,480 |
| Size | 8.9 GB | 3.0 GB |
| Events in quadrant A | 54,995,170 | 20,733,855 |
| Events in quadrant B | 67,405,385 | 20,244,819 |
| Events in quadrant C | 69,203,055 | 20,095,011 |
| Events in quadrant D | 82,469,560 | 19,512,428 |
| Mode M0 | |||
|---|---|---|---|
| Quadrant | BADHDUFLAG | Total packets | Discarded packets |
| A | 0 | 506280 | 0 |
| B | 0 | 566705 | 0 |
| C | 0 | 559245 | 0 |
| D | 0 | 619439 | 0 |
| Mode M9 | |||
|---|---|---|---|
| Quadrant | BADHDUFLAG | Total packets | Discarded packets |
| A | 0 | 366 | 0 |
| B | 0 | 366 | 0 |
| C | 0 | 366 | 0 |
| D | 0 | 366 | 0 |
| Mode SS | |||
|---|---|---|---|
| Quadrant | BADHDUFLAG | Total packets | Discarded packets |
| A | 0 | 4834 | 0 |
| B | 0 | 4830 | 0 |
| C | 0 | 4834 | 0 |
| D | 0 | 4834 | 0 |
| Quadrant | Total seconds | Saturated seconds | Saturation percentage |
|---|---|---|---|
| A | 237417 | 3488 | 1.469145% |
| B | 237419 | 9488 | 3.996310% |
| C | 237426 | 4012 | 1.689790% |
| D | 237397 | 11935 | 5.027443% |
Noise dominated data is calculated using 1-second bins in cleaned event files. If a bin has >2000 counts, and if more than 50% of those come from <1% of pixels, then it is considered to be noise-dominated and hence unusable.
| Quadrant | # 1 sec bins | Bins with >0 counts | Bins with >2000 counts | High rate bins dominated by noise | Noise dominated (total time) | Noise dominated (detector-on time) | Marked lightcurve |
|---|---|---|---|---|---|---|---|
| A | 274519 | 237479 | 92 | 92 | 0.03% | 0.04% |  |
| B | 274519 | 237497 | 647 | 647 | 0.24% | 0.27% |  |
| C | 274519 | 237503 | 20 | 20 | 0.01% | 0.01% |  |
| D | 274519 | 237472 | 994 | 994 | 0.36% | 0.42% |  |
Top three noisy pixels from each quadrant. If the there are fewer than three noisy pixels in the level2.evt file, extra rows are filled as -1
| Pixel properties | Quadrant properties | ||||||
|---|---|---|---|---|---|---|---|
| Quadrant | DetID | PixID | Counts | Sigma | Mean | Median | Sigma |
| A | 8 | 15 | 2784769 | 1016.59 | 12519 | 12302 | 2727.2 |
| A | 12 | 189 | 2643719 | 964.87 | 12519 | 12302 | 2727.2 |
| A | 4 | 2 | 577580 | 207.27 | 12519 | 12302 | 2727.2 |
| B | 10 | 16 | 6209254 | 2707.71 | 12264 | 11948 | 2288.8 |
| B | 0 | 85 | 3144386 | 1368.62 | 12264 | 11948 | 2288.8 |
| B | 0 | 219 | 2020728 | 877.67 | 12264 | 11948 | 2288.8 |
| C | 3 | 233 | 21468971 | 8191.75 | 11996 | 11834 | 2619.4 |
| C | 0 | 207 | 445865 | 165.7 | 11996 | 11834 | 2619.4 |
| C | 14 | 234 | 186582 | 66.71 | 11996 | 11834 | 2619.4 |
| D | 13 | 122 | 11614020 | 3976.81 | 12025 | 11698 | 2917.5 |
| D | 12 | 110 | 7555786 | 2585.81 | 12025 | 11698 | 2917.5 |
| D | 10 | 199 | 6999583 | 2395.16 | 12025 | 11698 | 2917.5 |
Histogram calculated using DETX and DETY for each event in the final _common_clean file
| Quadrant A |  |
 |
Quadrant B |
|---|---|---|---|
| Quadrant D |  |
 |
Quadrant C |
| Plot type | Count rate plots | Images |
|---|---|---|
| Comparison with Poisson distribution Blue bars denote a histogram of data divided into 1 sec bins. Red curve is a Poisson curve with rate = median count rate of data. |
 |
 |
| Quadrant-wise count rates Data is divided into 100 sec bins |
 |
|
| Module-wise count rates for Quadrant A Data is divided into 100 sec bins |
 |
 |
| Module-wise count rates for Quadrant B Data is divided into 100 sec bins |
 |
 |
| Module-wise count rates for Quadrant C Data is divided into 100 sec bins |
 |
 |
| Module-wise count rates for Quadrant D Data is divided into 100 sec bins |
 |
 |
| Parameter | Plot |
|---|---|
| CZT HV Monitor |  |
| D_VDD |  |
| Temperature 1 |  |
| Veto HV Monitor |  |
| Veto LLD | 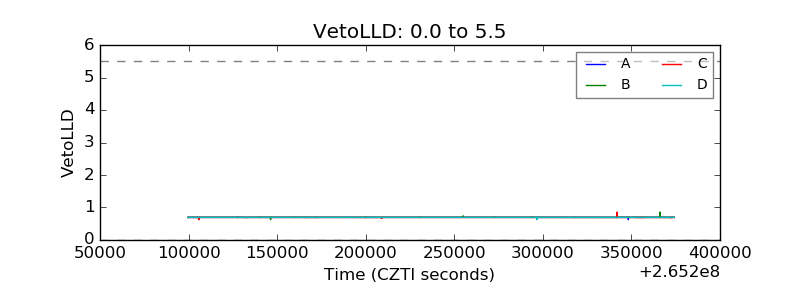 |
| Alpha Counter |  |
| _CPM_Rate |  |
| CZT Counter |  |
| +2.5 Volts monitor |  |
| +5 Volts monitor |  |
| _ROLL_ROT | 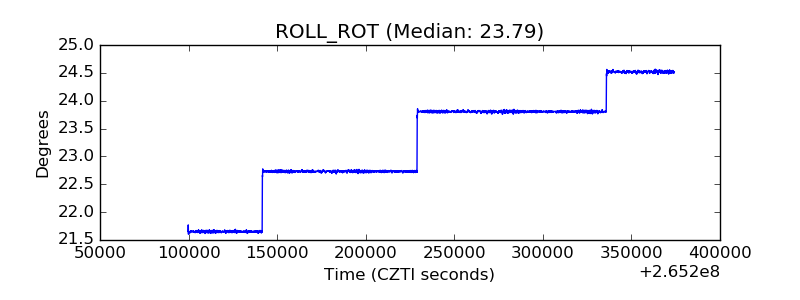 |
| _Roll_DEC |  |
| _Roll_RA |  |
| Veto Counter |  |