| Param | Original file | Final file |
|---|---|---|
| Filename | modeM0/AS1A04_201T03_9000002128cztM0_level2_bc.evt | modeM0/AS1A04_201T03_9000002128cztM0_level2_quad_clean.evt |
| Size (bytes) | 1,471,599,360 | 507,545,280 |
| Size | 1.4 GB | 484.0 MB |
| Events in quadrant A | 8,714,342 | 3,230,674 |
| Events in quadrant B | 9,391,621 | 3,261,585 |
| Events in quadrant C | 12,032,766 | 3,149,238 |
| Events in quadrant D | 11,777,797 | 3,062,950 |
| Mode M0 | |||
|---|---|---|---|
| Quadrant | BADHDUFLAG | Total packets | Discarded packets |
| A | 0 | 81724 | 0 |
| B | 0 | 85097 | 0 |
| C | 0 | 94355 | 0 |
| D | 0 | 94247 | 0 |
| Mode SS | |||
|---|---|---|---|
| Quadrant | BADHDUFLAG | Total packets | Discarded packets |
| A | 0 | 794 | 0 |
| B | 0 | 794 | 0 |
| C | 0 | 794 | 0 |
| D | 0 | 794 | 0 |
| Mode M9 | |||
|---|---|---|---|
| Quadrant | BADHDUFLAG | Total packets | Discarded packets |
| A | 0 | 60 | 0 |
| B | 0 | 60 | 0 |
| C | 0 | 60 | 0 |
| D | 0 | 60 | 0 |
| Quadrant | Total seconds | Saturated seconds | Saturation percentage |
|---|---|---|---|
| A | 38845 | 712 | 1.832926% |
| B | 38845 | 925 | 2.381259% |
| C | 38845 | 960 | 2.471361% |
| D | 38845 | 986 | 2.538293% |
Noise dominated data is calculated using 1-second bins in cleaned event files. If a bin has >2000 counts, and if more than 50% of those come from <1% of pixels, then it is considered to be noise-dominated and hence unusable.
| Quadrant | # 1 sec bins | Bins with >0 counts | Bins with >2000 counts | High rate bins dominated by noise | Noise dominated (total time) | Noise dominated (detector-on time) | Marked lightcurve |
|---|---|---|---|---|---|---|---|
| A | 49808 | 38844 | 1 | 1 | 0.00% | 0.00% |  |
| B | 49808 | 38841 | 3 | 3 | 0.01% | 0.01% |  |
| C | 49808 | 38843 | 25 | 25 | 0.05% | 0.06% | 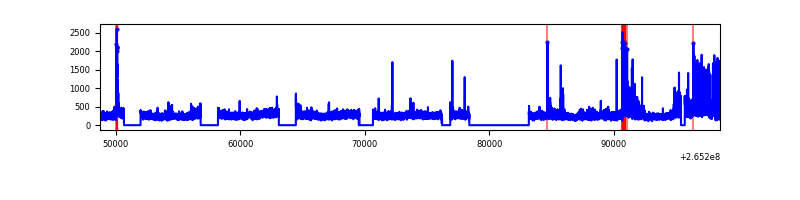 |
| D | 49808 | 38843 | 28 | 28 | 0.06% | 0.07% |  |
Top three noisy pixels from each quadrant. If the there are fewer than three noisy pixels in the level2.evt file, extra rows are filled as -1
| Pixel properties | Quadrant properties | ||||||
|---|---|---|---|---|---|---|---|
| Quadrant | DetID | PixID | Counts | Sigma | Mean | Median | Sigma |
| A | 12 | 189 | 390299 | 855.71 | 2079 | 2035 | 453.7 |
| A | 8 | 15 | 237759 | 519.52 | 2079 | 2035 | 453.7 |
| A | 11 | 29 | 36681 | 76.36 | 2079 | 2035 | 453.7 |
| B | 0 | 189 | 222783 | 570.86 | 2093 | 2045 | 386.7 |
| B | 0 | 229 | 219944 | 563.52 | 2093 | 2045 | 386.7 |
| B | 0 | 182 | 210890 | 540.1 | 2093 | 2045 | 386.7 |
| C | 3 | 233 | 3709669 | 8445.39 | 2014 | 1988 | 439.0 |
| C | 0 | 207 | 415526 | 941.96 | 2014 | 1988 | 439.0 |
| C | 10 | 22 | 16131 | 32.22 | 2014 | 1988 | 439.0 |
| D | 13 | 122 | 1909149 | 4000.17 | 2016 | 1957 | 476.8 |
| D | 2 | 120 | 795060 | 1663.47 | 2016 | 1957 | 476.8 |
| D | 10 | 199 | 242584 | 504.69 | 2016 | 1957 | 476.8 |
Histogram calculated using DETX and DETY for each event in the final _common_clean file
| Quadrant A |  |
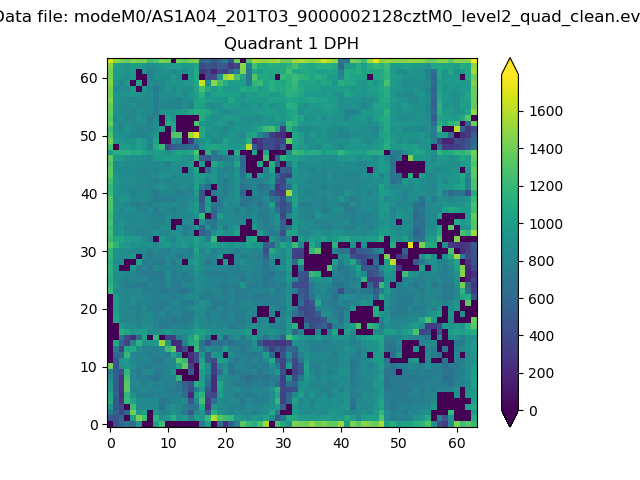 |
Quadrant B |
|---|---|---|---|
| Quadrant D | 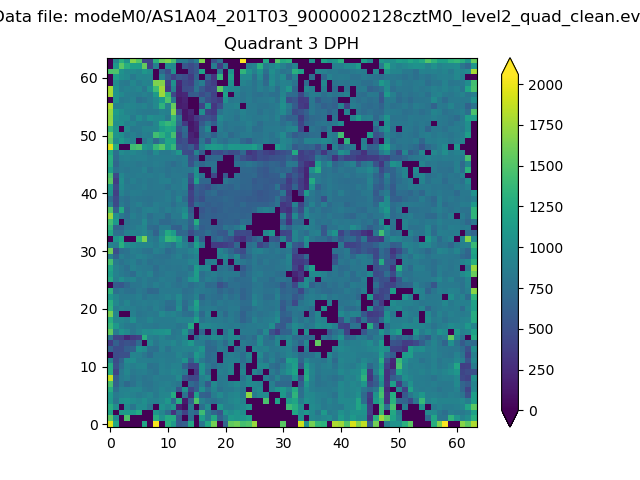 |
 |
Quadrant C |
| Plot type | Count rate plots | Images |
|---|---|---|
| Comparison with Poisson distribution Blue bars denote a histogram of data divided into 1 sec bins. Red curve is a Poisson curve with rate = median count rate of data. |
 |
 |
| Quadrant-wise count rates Data is divided into 100 sec bins |
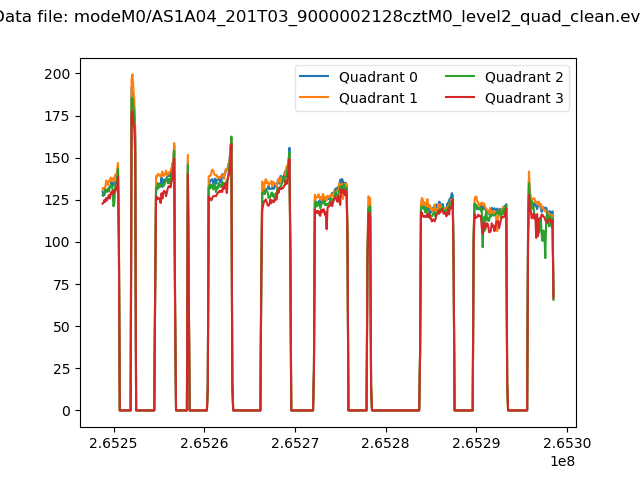 |
|
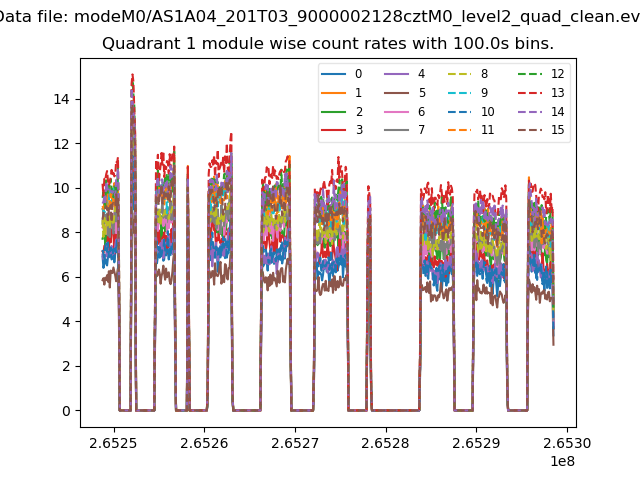
| Module-wise count rates for Quadrant A Data is divided into 100 sec bins |
 |
 |
| Module-wise count rates for Quadrant B Data is divided into 100 sec bins |
 |
 |
| Module-wise count rates for Quadrant C Data is divided into 100 sec bins |
 |
 |
| Module-wise count rates for Quadrant D Data is divided into 100 sec bins |
 |
 |
| Parameter | Plot |
|---|---|
| CZT HV Monitor | 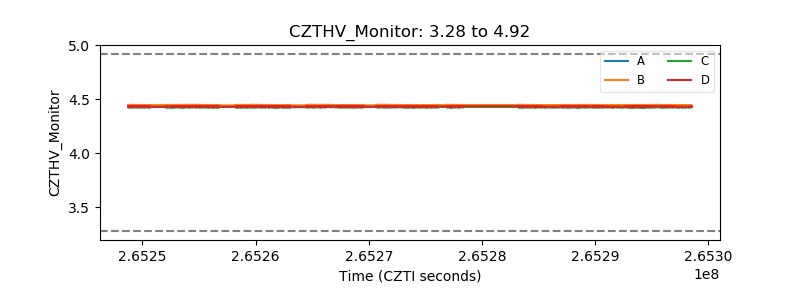 |
| D_VDD |  |
| Temperature 1 |  |
| Veto HV Monitor |  |
| Veto LLD |  |
| Alpha Counter |  |
| _CPM_Rate | 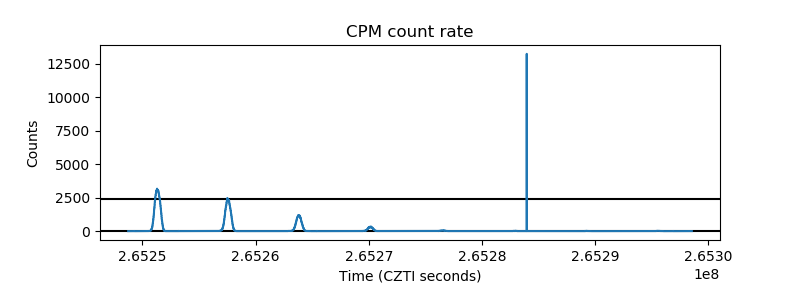 |
| CZT Counter |  |
| +2.5 Volts monitor | 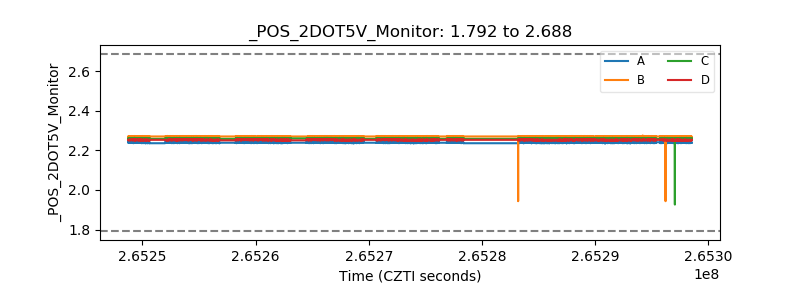 |
| +5 Volts monitor |  |
| _ROLL_ROT |  |
| _Roll_DEC |  |
| _Roll_RA |  |
| Veto Counter |  |