| Param | Original file | Final file |
|---|---|---|
| Filename | modeM0/AS1A04_186T01_9000002126cztM0_level2_bc.evt | modeM0/AS1A04_186T01_9000002126cztM0_level2_quad_clean.evt |
| Size (bytes) | 1,329,171,840 | 458,069,760 |
| Size | 1.2 GB | 436.8 MB |
| Events in quadrant A | 6,789,257 | 3,043,484 |
| Events in quadrant B | 7,478,886 | 2,954,934 |
| Events in quadrant C | 10,553,671 | 2,914,865 |
| Events in quadrant D | 13,328,504 | 2,842,025 |
| Mode M0 | |||
|---|---|---|---|
| Quadrant | BADHDUFLAG | Total packets | Discarded packets |
| A | 0 | 64502 | 0 |
| B | 0 | 68407 | 0 |
| C | 0 | 80085 | 0 |
| D | 0 | 92292 | 0 |
| Mode M9 | |||
|---|---|---|---|
| Quadrant | BADHDUFLAG | Total packets | Discarded packets |
| A | 0 | 55 | 0 |
| B | 0 | 55 | 0 |
| C | 0 | 55 | 0 |
| D | 0 | 55 | 0 |
| Mode SS | |||
|---|---|---|---|
| Quadrant | BADHDUFLAG | Total packets | Discarded packets |
| A | 0 | 626 | 0 |
| B | 0 | 626 | 0 |
| C | 0 | 626 | 0 |
| D | 0 | 626 | 0 |
| Quadrant | Total seconds | Saturated seconds | Saturation percentage |
|---|---|---|---|
| A | 30852 | 218 | 0.706599% |
| B | 30852 | 505 | 1.636847% |
| C | 30852 | 339 | 1.098794% |
| D | 30852 | 2468 | 7.999481% |
Noise dominated data is calculated using 1-second bins in cleaned event files. If a bin has >2000 counts, and if more than 50% of those come from <1% of pixels, then it is considered to be noise-dominated and hence unusable.
| Quadrant | # 1 sec bins | Bins with >0 counts | Bins with >2000 counts | High rate bins dominated by noise | Noise dominated (total time) | Noise dominated (detector-on time) | Marked lightcurve |
|---|---|---|---|---|---|---|---|
| A | 36193 | 30849 | 4 | 4 | 0.01% | 0.01% |  |
| B | 36193 | 30850 | 6 | 6 | 0.02% | 0.02% |  |
| C | 36193 | 30853 | 10 | 10 | 0.03% | 0.03% |  |
| D | 36193 | 30851 | 136 | 136 | 0.38% | 0.44% |  |
Top three noisy pixels from each quadrant. If the there are fewer than three noisy pixels in the level2.evt file, extra rows are filled as -1
| Pixel properties | Quadrant properties | ||||||
|---|---|---|---|---|---|---|---|
| Quadrant | DetID | PixID | Counts | Sigma | Mean | Median | Sigma |
| A | 12 | 189 | 242857 | 668.03 | 1611 | 1583 | 361.2 |
| A | 8 | 15 | 216159 | 594.11 | 1611 | 1583 | 361.2 |
| A | 4 | 2 | 86491 | 235.09 | 1611 | 1583 | 361.2 |
| B | 0 | 85 | 310679 | 1020.73 | 1579 | 1535 | 302.9 |
| B | 0 | 229 | 288268 | 946.73 | 1579 | 1535 | 302.9 |
| B | 0 | 189 | 233343 | 765.38 | 1579 | 1535 | 302.9 |
| C | 3 | 233 | 4421116 | 13006.0 | 1532 | 1517 | 339.8 |
| C | 0 | 207 | 120943 | 351.45 | 1532 | 1517 | 339.8 |
| C | 14 | 234 | 10331 | 25.94 | 1532 | 1517 | 339.8 |
| D | 13 | 122 | 4399176 | 11820.18 | 1530 | 1483 | 372.0 |
| D | 10 | 199 | 948852 | 2546.35 | 1530 | 1483 | 372.0 |
| D | 12 | 110 | 557510 | 1494.5 | 1530 | 1483 | 372.0 |
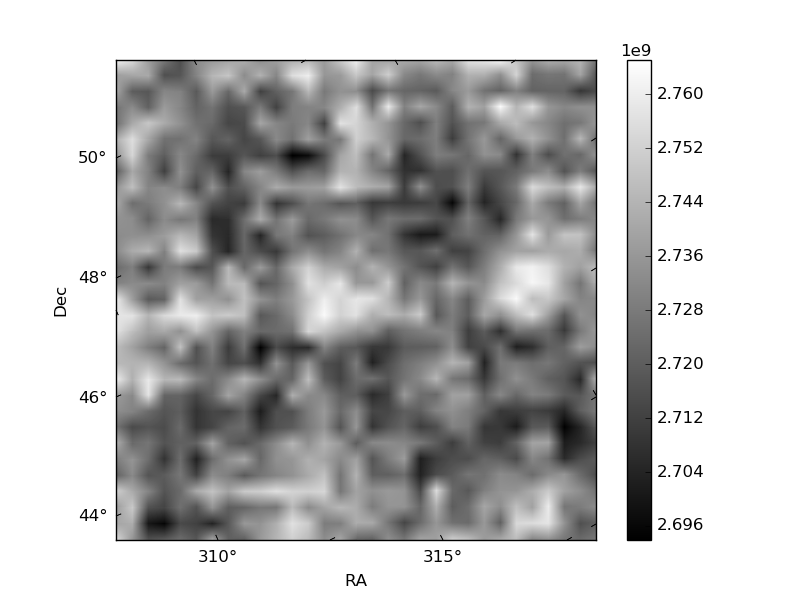
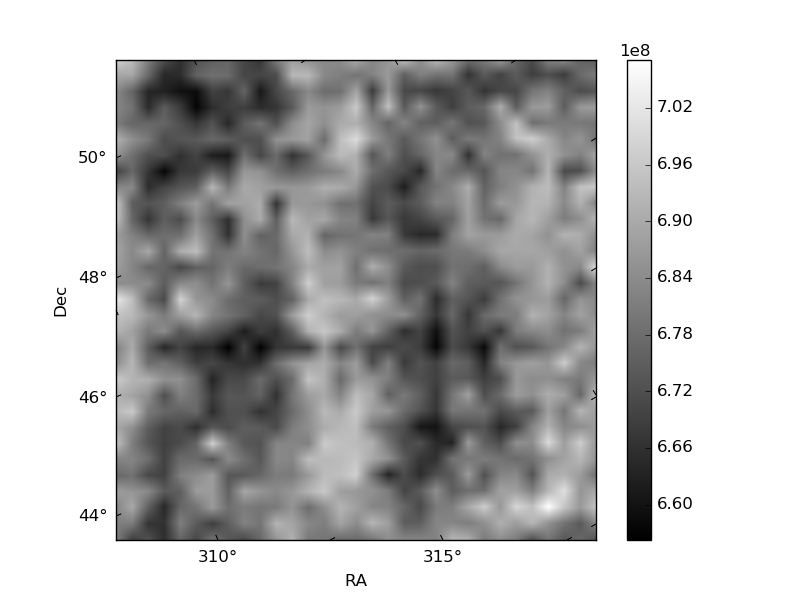
Histogram calculated using DETX and DETY for each event in the final _common_clean file
| Quadrant A |  |
 |
Quadrant B |
|---|---|---|---|
| Quadrant D |  |
 |
Quadrant C |
| Plot type | Count rate plots | Images |
|---|---|---|
| Comparison with Poisson distribution Blue bars denote a histogram of data divided into 1 sec bins. Red curve is a Poisson curve with rate = median count rate of data. |
 |
 |
| Quadrant-wise count rates Data is divided into 100 sec bins |
 |
|
| Module-wise count rates for Quadrant A Data is divided into 100 sec bins |
 |
 |
| Module-wise count rates for Quadrant B Data is divided into 100 sec bins |
 |
 |
| Module-wise count rates for Quadrant C Data is divided into 100 sec bins |
 |
 |
| Module-wise count rates for Quadrant D Data is divided into 100 sec bins |
 |
 |
| Parameter | Plot |
|---|---|
| CZT HV Monitor |  |
| D_VDD |  |
| Temperature 1 |  |
| Veto HV Monitor | 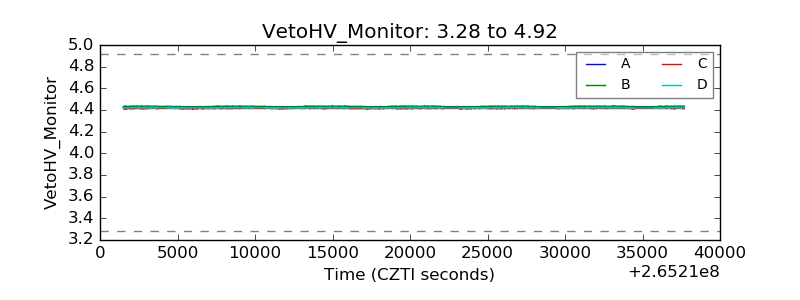 |
| Veto LLD |  |
| Alpha Counter |  |
| _CPM_Rate |  |
| CZT Counter |  |
| +2.5 Volts monitor |  |
| +5 Volts monitor |  |
| _ROLL_ROT | 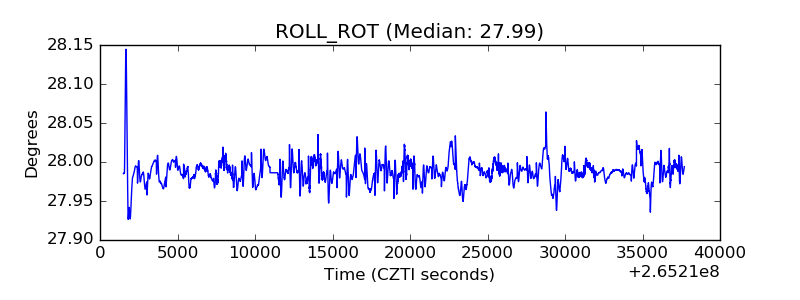 |
| _Roll_DEC |  |
| _Roll_RA | 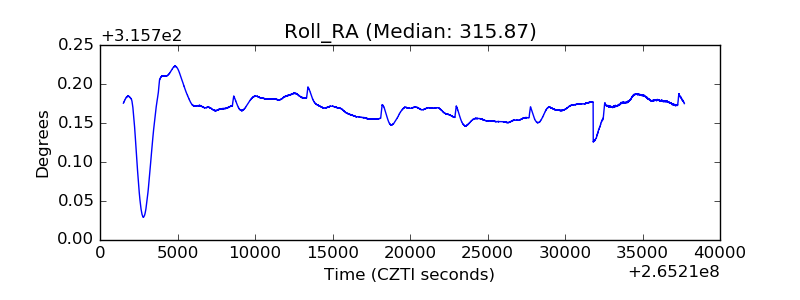 |
| Veto Counter |  |