| Param | Original file | Final file |
|---|---|---|
| Filename | modeM0/AS1A04_023T02_9000002124cztM0_level2_bc.evt | modeM0/AS1A04_023T02_9000002124cztM0_level2_quad_clean.evt |
| Size (bytes) | 1,298,056,320 | 428,898,240 |
| Size | 1.2 GB | 409.0 MB |
| Events in quadrant A | 7,426,352 | 2,718,440 |
| Events in quadrant B | 8,294,369 | 2,719,376 |
| Events in quadrant C | 10,809,730 | 2,667,258 |
| Events in quadrant D | 10,485,561 | 2,574,971 |
| Mode SS | |||
|---|---|---|---|
| Quadrant | BADHDUFLAG | Total packets | Discarded packets |
| A | 0 | 682 | 0 |
| B | 0 | 682 | 0 |
| C | 0 | 682 | 0 |
| D | 0 | 682 | 0 |
| Mode M0 | |||
|---|---|---|---|
| Quadrant | BADHDUFLAG | Total packets | Discarded packets |
| A | 0 | 70977 | 0 |
| B | 0 | 75000 | 0 |
| C | 0 | 85706 | 0 |
| D | 0 | 81998 | 0 |
| Mode M9 | |||
|---|---|---|---|
| Quadrant | BADHDUFLAG | Total packets | Discarded packets |
| A | 0 | 42 | 0 |
| B | 0 | 42 | 0 |
| C | 0 | 42 | 0 |
| D | 0 | 42 | 0 |
| Quadrant | Total seconds | Saturated seconds | Saturation percentage |
|---|---|---|---|
| A | 33637 | 827 | 2.458602% |
| B | 33637 | 1183 | 3.516960% |
| C | 33637 | 739 | 2.196985% |
| D | 33637 | 1346 | 4.001546% |
Noise dominated data is calculated using 1-second bins in cleaned event files. If a bin has >2000 counts, and if more than 50% of those come from <1% of pixels, then it is considered to be noise-dominated and hence unusable.
| Quadrant | # 1 sec bins | Bins with >0 counts | Bins with >2000 counts | High rate bins dominated by noise | Noise dominated (total time) | Noise dominated (detector-on time) | Marked lightcurve |
|---|---|---|---|---|---|---|---|
| A | 37800 | 33636 | 11 | 11 | 0.03% | 0.03% | 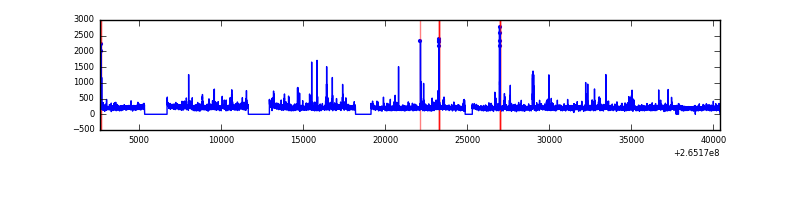 |
| B | 37800 | 33634 | 74 | 74 | 0.20% | 0.22% |  |
| C | 37800 | 33639 | 22 | 22 | 0.06% | 0.07% |  |
| D | 37800 | 33638 | 153 | 153 | 0.40% | 0.45% |  |
Top three noisy pixels from each quadrant. If the there are fewer than three noisy pixels in the level2.evt file, extra rows are filled as -1
| Pixel properties | Quadrant properties | ||||||
|---|---|---|---|---|---|---|---|
| Quadrant | DetID | PixID | Counts | Sigma | Mean | Median | Sigma |
| A | 12 | 189 | 287326 | 741.37 | 1766 | 1731 | 385.2 |
| A | 4 | 2 | 124271 | 318.1 | 1766 | 1731 | 385.2 |
| A | 8 | 15 | 104771 | 267.48 | 1766 | 1731 | 385.2 |
| B | 0 | 229 | 341470 | 1025.66 | 1772 | 1725 | 331.2 |
| B | 0 | 189 | 292404 | 877.54 | 1772 | 1725 | 331.2 |
| B | 8 | 3 | 273423 | 820.23 | 1772 | 1725 | 331.2 |
| C | 3 | 233 | 3910695 | 10262.86 | 1726 | 1699 | 380.9 |
| C | 0 | 207 | 129283 | 334.97 | 1726 | 1699 | 380.9 |
| C | 3 | 232 | 10313 | 22.62 | 1726 | 1699 | 380.9 |
| D | 13 | 122 | 1553869 | 3895.91 | 1716 | 1665 | 398.4 |
| D | 2 | 120 | 800526 | 2005.08 | 1716 | 1665 | 398.4 |
| D | 10 | 199 | 573893 | 1436.25 | 1716 | 1665 | 398.4 |
Histogram calculated using DETX and DETY for each event in the final _common_clean file
| Quadrant A |  |
 |
Quadrant B |
|---|---|---|---|
| Quadrant D | 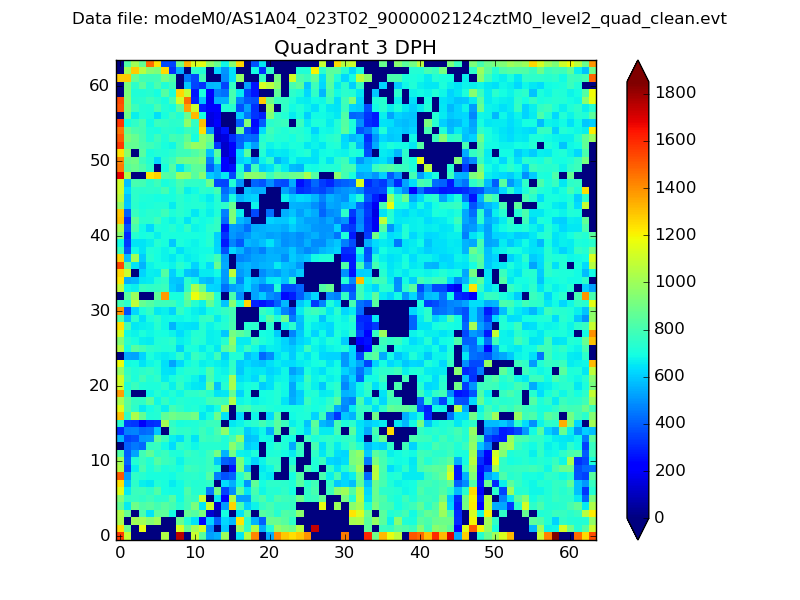 |
 |
Quadrant C |
| Plot type | Count rate plots | Images |
|---|---|---|
| Comparison with Poisson distribution Blue bars denote a histogram of data divided into 1 sec bins. Red curve is a Poisson curve with rate = median count rate of data. |
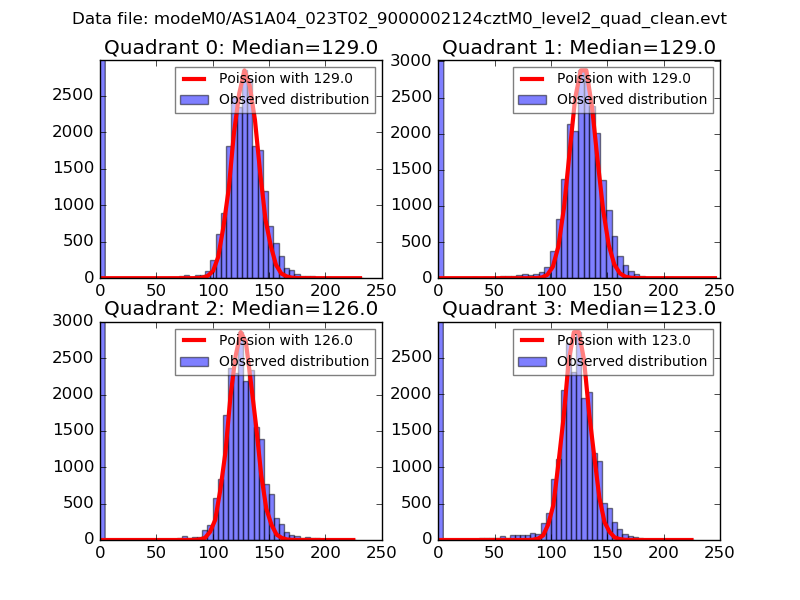 |
 |
| Quadrant-wise count rates Data is divided into 100 sec bins |
 |
|
| Module-wise count rates for Quadrant A Data is divided into 100 sec bins |
 |
 |
| Module-wise count rates for Quadrant B Data is divided into 100 sec bins |
 |
 |
| Module-wise count rates for Quadrant C Data is divided into 100 sec bins |
 |
 |
| Module-wise count rates for Quadrant D Data is divided into 100 sec bins |
 |
 |
| Parameter | Plot |
|---|---|
| CZT HV Monitor |  |
| D_VDD |  |
| Temperature 1 |  |
| Veto HV Monitor | 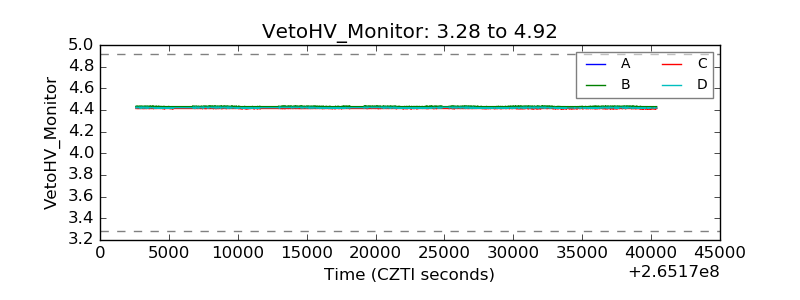 |
| Veto LLD |  |
| Alpha Counter |  |
| _CPM_Rate | 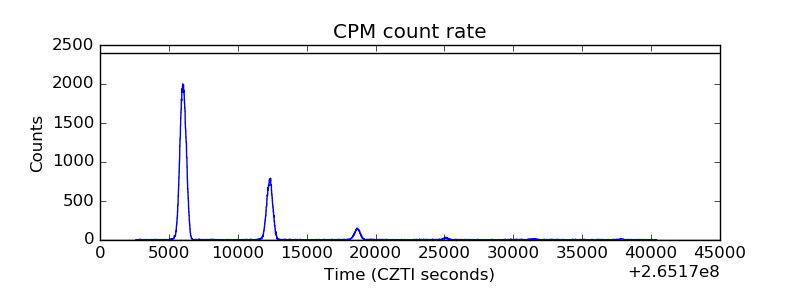 |
| CZT Counter |  |
| +2.5 Volts monitor | 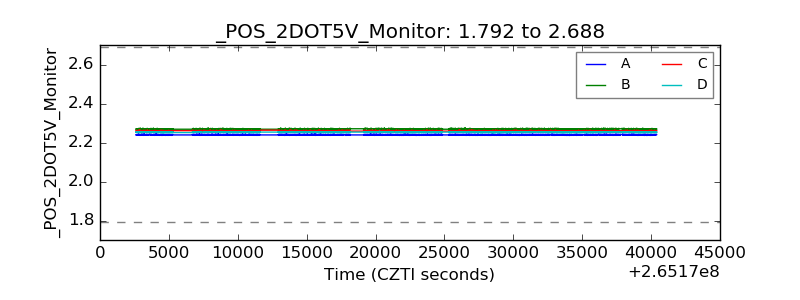 |
| +5 Volts monitor | 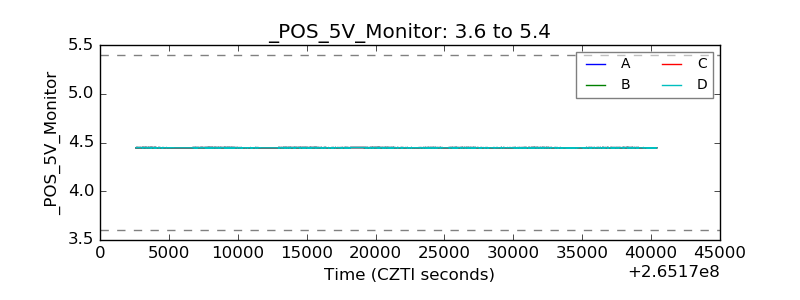 |
| _ROLL_ROT |  |
| _Roll_DEC |  |
| _Roll_RA |  |
| Veto Counter |  |