| Param | Original file | Final file |
|---|---|---|
| Filename | modeM0/AS1G08_066T04_9000002122cztM0_level2_bc.evt | modeM0/AS1G08_066T04_9000002122cztM0_level2_quad_clean.evt |
| Size (bytes) | 1,528,292,160 | 568,402,560 |
| Size | 1.4 GB | 542.1 MB |
| Events in quadrant A | 9,709,774 | 3,690,412 |
| Events in quadrant B | 9,246,019 | 3,737,998 |
| Events in quadrant C | 12,143,191 | 3,577,340 |
| Events in quadrant D | 12,479,874 | 3,487,019 |
| Mode SS | |||
|---|---|---|---|
| Quadrant | BADHDUFLAG | Total packets | Discarded packets |
| A | 0 | 810 | 0 |
| B | 0 | 810 | 0 |
| C | 0 | 810 | 0 |
| D | 0 | 810 | 0 |
| Mode M9 | |||
|---|---|---|---|
| Quadrant | BADHDUFLAG | Total packets | Discarded packets |
| A | 0 | 74 | 0 |
| B | 0 | 74 | 0 |
| C | 0 | 74 | 0 |
| D | 0 | 74 | 0 |
| Mode M0 | |||
|---|---|---|---|
| Quadrant | BADHDUFLAG | Total packets | Discarded packets |
| A | 0 | 85785 | 0 |
| B | 0 | 86113 | 0 |
| C | 0 | 95286 | 0 |
| D | 0 | 95700 | 0 |
| Quadrant | Total seconds | Saturated seconds | Saturation percentage |
|---|---|---|---|
| A | 39680 | 358 | 0.902218% |
| B | 39680 | 567 | 1.428931% |
| C | 39680 | 284 | 0.715726% |
| D | 39680 | 1408 | 3.548387% |
Noise dominated data is calculated using 1-second bins in cleaned event files. If a bin has >2000 counts, and if more than 50% of those come from <1% of pixels, then it is considered to be noise-dominated and hence unusable.
| Quadrant | # 1 sec bins | Bins with >0 counts | Bins with >2000 counts | High rate bins dominated by noise | Noise dominated (total time) | Noise dominated (detector-on time) | Marked lightcurve |
|---|---|---|---|---|---|---|---|
| A | 47121 | 39677 | 4 | 4 | 0.01% | 0.01% |  |
| B | 47121 | 39676 | 4 | 4 | 0.01% | 0.01% |  |
| C | 47121 | 39677 | 2 | 2 | 0.00% | 0.01% |  |
| D | 47121 | 39677 | 462 | 462 | 0.98% | 1.16% |  |
Top three noisy pixels from each quadrant. If the there are fewer than three noisy pixels in the level2.evt file, extra rows are filled as -1
| Pixel properties | Quadrant properties | ||||||
|---|---|---|---|---|---|---|---|
| Quadrant | DetID | PixID | Counts | Sigma | Mean | Median | Sigma |
| A | 8 | 15 | 1369621 | 2992.51 | 2078 | 2032 | 457.0 |
| A | 12 | 189 | 178004 | 385.06 | 2078 | 2032 | 457.0 |
| A | 15 | 69 | 44822 | 93.63 | 2078 | 2032 | 457.0 |
| B | 0 | 229 | 341887 | 850.02 | 2093 | 2037 | 399.8 |
| B | 0 | 189 | 266306 | 660.98 | 2093 | 2037 | 399.8 |
| B | 4 | 142 | 167645 | 414.21 | 2093 | 2037 | 399.8 |
| C | 3 | 233 | 4170659 | 9283.25 | 2025 | 2000 | 449.1 |
| C | 14 | 234 | 36159 | 76.07 | 2025 | 2000 | 449.1 |
| C | 3 | 232 | 13905 | 26.51 | 2025 | 2000 | 449.1 |
| D | 15 | 0 | 1402256 | 2946.02 | 2006 | 1949 | 475.3 |
| D | 2 | 120 | 711005 | 1491.74 | 2006 | 1949 | 475.3 |
| D | 10 | 199 | 659029 | 1382.39 | 2006 | 1949 | 475.3 |
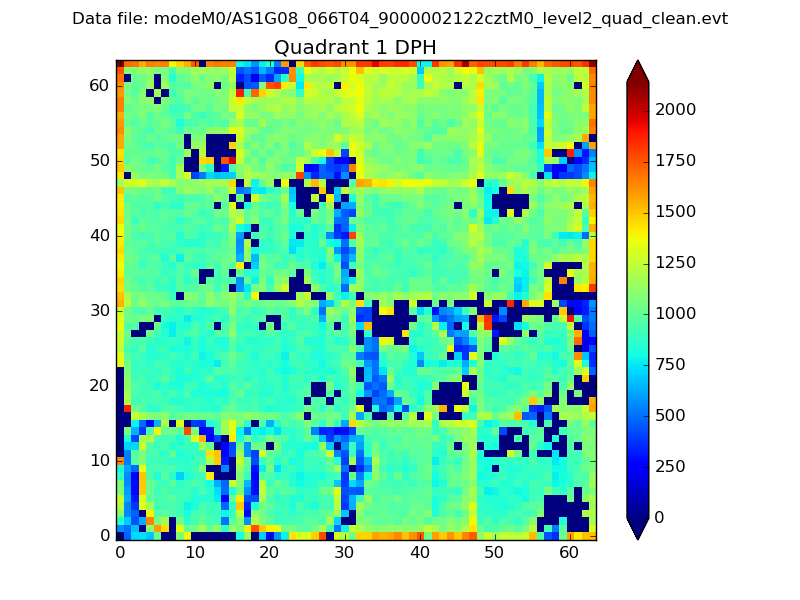
Histogram calculated using DETX and DETY for each event in the final _common_clean file
| Quadrant A |  |
 |
Quadrant B |
|---|---|---|---|
| Quadrant D |  |
 |
Quadrant C |
| Plot type | Count rate plots | Images |
|---|---|---|
| Comparison with Poisson distribution Blue bars denote a histogram of data divided into 1 sec bins. Red curve is a Poisson curve with rate = median count rate of data. |
 |
 |
| Quadrant-wise count rates Data is divided into 100 sec bins |
 |
|
| Module-wise count rates for Quadrant A Data is divided into 100 sec bins |
 |
 |
| Module-wise count rates for Quadrant B Data is divided into 100 sec bins |
 |
 |
| Module-wise count rates for Quadrant C Data is divided into 100 sec bins |
 |
 |
| Module-wise count rates for Quadrant D Data is divided into 100 sec bins |
 |
 |
| Parameter | Plot |
|---|---|
| CZT HV Monitor |  |
| D_VDD |  |
| Temperature 1 |  |
| Veto HV Monitor |  |
| Veto LLD | 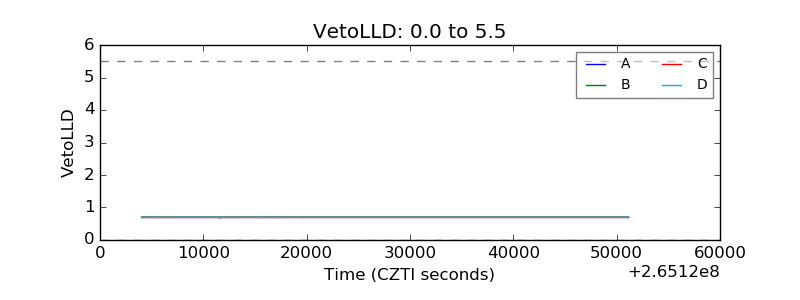 |
| Alpha Counter | 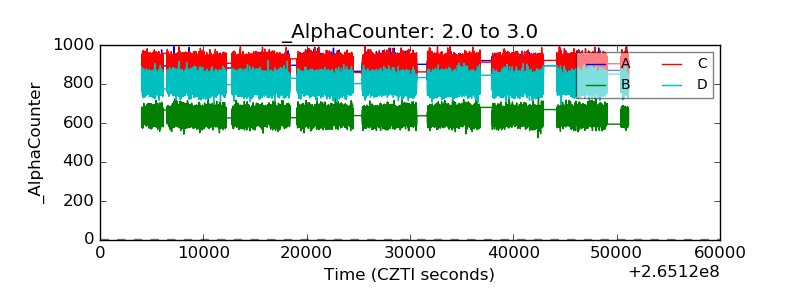 |
| _CPM_Rate |  |
| CZT Counter | 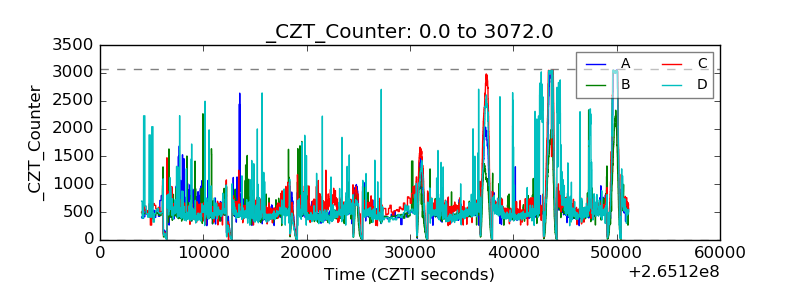 |
| +2.5 Volts monitor |  |
| +5 Volts monitor | 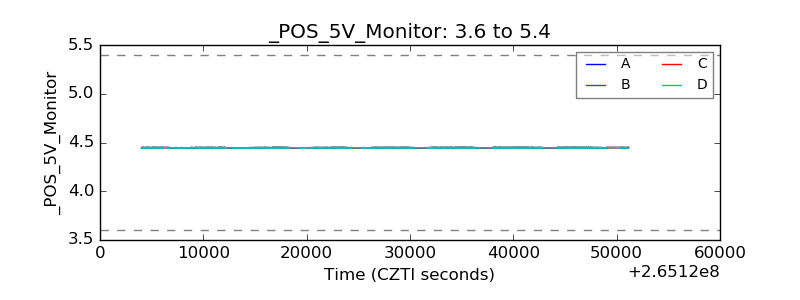 |
| _ROLL_ROT |  |
| _Roll_DEC | 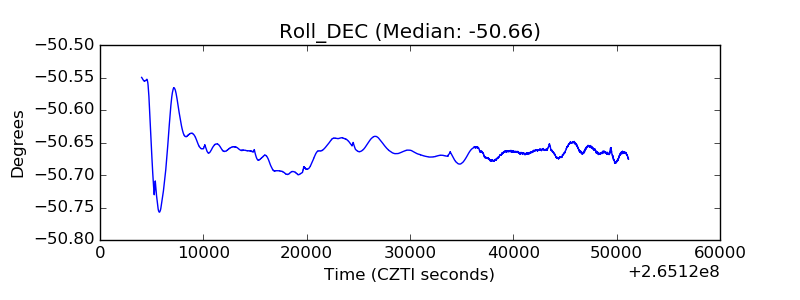 |
| _Roll_RA |  |
| Veto Counter |  |