| Param | Original file | Final file |
|---|---|---|
| Filename | modeM0/AS1G08_075T01_9000002120cztM0_level2_bc.evt | modeM0/AS1G08_075T01_9000002120cztM0_level2_quad_clean.evt |
| Size (bytes) | 1,898,104,320 | 504,002,880 |
| Size | 1.8 GB | 480.7 MB |
| Events in quadrant A | 8,749,160 | 3,284,449 |
| Events in quadrant B | 11,389,350 | 3,214,995 |
| Events in quadrant C | 11,664,900 | 3,174,504 |
| Events in quadrant D | 22,992,868 | 2,881,720 |
| Mode SS | |||
|---|---|---|---|
| Quadrant | BADHDUFLAG | Total packets | Discarded packets |
| A | 0 | 806 | 0 |
| B | 0 | 806 | 0 |
| C | 0 | 806 | 0 |
| D | 0 | 806 | 0 |
| Mode M0 | |||
|---|---|---|---|
| Quadrant | BADHDUFLAG | Total packets | Discarded packets |
| A | 0 | 82718 | 0 |
| B | 0 | 94408 | 0 |
| C | 0 | 92560 | 0 |
| D | 0 | 127961 | 0 |
| Mode M9 | |||
|---|---|---|---|
| Quadrant | BADHDUFLAG | Total packets | Discarded packets |
| A | 0 | 55 | 0 |
| B | 0 | 55 | 0 |
| C | 0 | 55 | 0 |
| D | 0 | 55 | 0 |
| Quadrant | Total seconds | Saturated seconds | Saturation percentage |
|---|---|---|---|
| A | 39426 | 815 | 2.067164% |
| B | 39426 | 1798 | 4.560442% |
| C | 39426 | 655 | 1.661340% |
| D | 39426 | 6067 | 15.388322% |
Noise dominated data is calculated using 1-second bins in cleaned event files. If a bin has >2000 counts, and if more than 50% of those come from <1% of pixels, then it is considered to be noise-dominated and hence unusable.
| Quadrant | # 1 sec bins | Bins with >0 counts | Bins with >2000 counts | High rate bins dominated by noise | Noise dominated (total time) | Noise dominated (detector-on time) | Marked lightcurve |
|---|---|---|---|---|---|---|---|
| A | 56148 | 39424 | 23 | 23 | 0.04% | 0.06% |  |
| B | 56148 | 39421 | 75 | 75 | 0.13% | 0.19% | 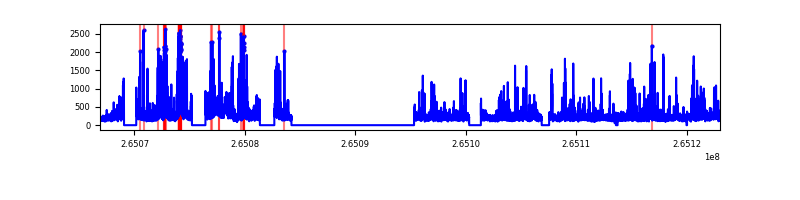 |
| C | 56148 | 39424 | 2 | 2 | 0.00% | 0.01% |  |
| D | 56148 | 39422 | 4246 | 4246 | 7.56% | 10.77% |  |
Top three noisy pixels from each quadrant. If the there are fewer than three noisy pixels in the level2.evt file, extra rows are filled as -1
| Pixel properties | Quadrant properties | ||||||
|---|---|---|---|---|---|---|---|
| Quadrant | DetID | PixID | Counts | Sigma | Mean | Median | Sigma |
| A | 8 | 15 | 278897 | 594.91 | 2122 | 2084 | 465.3 |
| A | 12 | 189 | 117410 | 247.85 | 2122 | 2084 | 465.3 |
| A | 15 | 69 | 78045 | 163.25 | 2122 | 2084 | 465.3 |
| B | 10 | 245 | 2054370 | 5172.73 | 2089 | 2042 | 396.8 |
| B | 0 | 229 | 397572 | 996.9 | 2089 | 2042 | 396.8 |
| B | 0 | 189 | 298172 | 746.37 | 2089 | 2042 | 396.8 |
| C | 3 | 233 | 3635201 | 8159.78 | 2036 | 2014 | 445.3 |
| C | 3 | 232 | 23702 | 48.71 | 2036 | 2014 | 445.3 |
| C | 14 | 234 | 18921 | 37.97 | 2036 | 2014 | 445.3 |
| D | 1 | 52 | 11099616 | 23691.25 | 1894 | 1841 | 468.4 |
| D | 12 | 110 | 2681016 | 5719.43 | 1894 | 1841 | 468.4 |
| D | 2 | 120 | 753410 | 1604.43 | 1894 | 1841 | 468.4 |
Histogram calculated using DETX and DETY for each event in the final _common_clean file
| Quadrant A |  |
 |
Quadrant B |
|---|---|---|---|
| Quadrant D |  |
 |
Quadrant C |
| Plot type | Count rate plots | Images |
|---|---|---|
| Comparison with Poisson distribution Blue bars denote a histogram of data divided into 1 sec bins. Red curve is a Poisson curve with rate = median count rate of data. |
 |
 |
| Quadrant-wise count rates Data is divided into 100 sec bins |
 |
|
| Module-wise count rates for Quadrant A Data is divided into 100 sec bins |
 |
 |
| Module-wise count rates for Quadrant B Data is divided into 100 sec bins |
 |
 |
| Module-wise count rates for Quadrant C Data is divided into 100 sec bins |
 |
 |
| Module-wise count rates for Quadrant D Data is divided into 100 sec bins |
 |
 |
| Parameter | Plot |
|---|---|
| CZT HV Monitor | 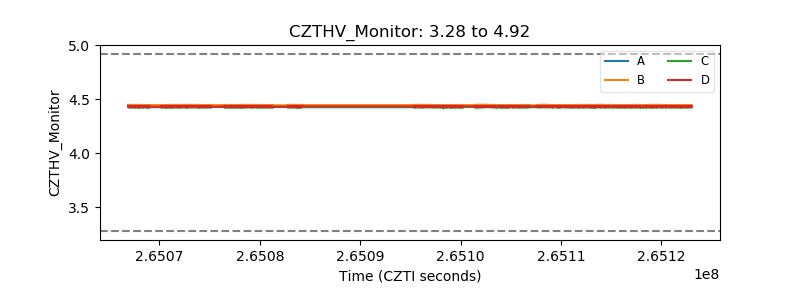 |
| D_VDD |  |
| Temperature 1 |  |
| Veto HV Monitor |  |
| Veto LLD | 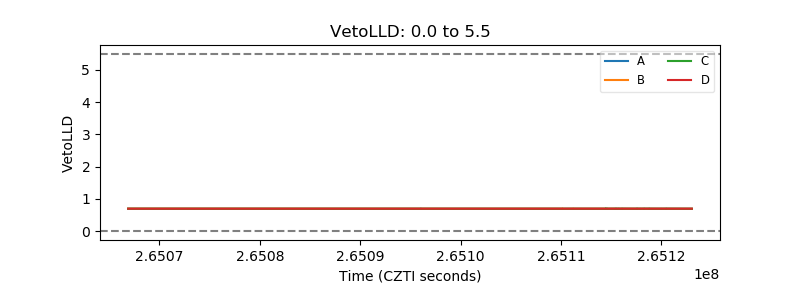 |
| Alpha Counter |  |
| _CPM_Rate |  |
| CZT Counter |  |
| +2.5 Volts monitor |  |
| +5 Volts monitor |  |
| _ROLL_ROT |  |
| _Roll_DEC |  |
| _Roll_RA |  |
| Veto Counter |  |