| Param | Original file | Final file |
|---|---|---|
| Filename | modeM0/AS1T02_046T01_9000002116cztM0_level2_bc.evt | modeM0/AS1T02_046T01_9000002116cztM0_level2_quad_clean.evt |
| Size (bytes) | 530,297,280 | 203,673,600 |
| Size | 505.7 MB | 194.2 MB |
| Events in quadrant A | 3,063,049 | 1,312,888 |
| Events in quadrant B | 3,820,393 | 1,311,639 |
| Events in quadrant C | 4,079,864 | 1,262,659 |
| Events in quadrant D | 4,064,824 | 1,243,744 |
| Mode SS | |||
|---|---|---|---|
| Quadrant | BADHDUFLAG | Total packets | Discarded packets |
| A | 0 | 306 | 0 |
| B | 0 | 306 | 0 |
| C | 0 | 306 | 0 |
| D | 0 | 306 | 0 |
| Mode M9 | |||
|---|---|---|---|
| Quadrant | BADHDUFLAG | Total packets | Discarded packets |
| A | 0 | 23 | 0 |
| B | 0 | 23 | 0 |
| C | 0 | 23 | 0 |
| D | 0 | 23 | 0 |
| Mode M0 | |||
|---|---|---|---|
| Quadrant | BADHDUFLAG | Total packets | Discarded packets |
| A | 0 | 30908 | 0 |
| B | 0 | 34026 | 0 |
| C | 0 | 33592 | 0 |
| D | 0 | 35116 | 0 |
| Quadrant | Total seconds | Saturated seconds | Saturation percentage |
|---|---|---|---|
| A | 15045 | 157 | 1.043536% |
| B | 15045 | 402 | 2.671984% |
| C | 15045 | 133 | 0.884015% |
| D | 15045 | 472 | 3.137255% |
Noise dominated data is calculated using 1-second bins in cleaned event files. If a bin has >2000 counts, and if more than 50% of those come from <1% of pixels, then it is considered to be noise-dominated and hence unusable.
| Quadrant | # 1 sec bins | Bins with >0 counts | Bins with >2000 counts | High rate bins dominated by noise | Noise dominated (total time) | Noise dominated (detector-on time) | Marked lightcurve |
|---|---|---|---|---|---|---|---|
| A | 17236 | 15044 | 1 | 1 | 0.01% | 0.01% |  |
| B | 17236 | 15044 | 8 | 8 | 0.05% | 0.05% |  |
| C | 17236 | 15043 | 1 | 1 | 0.01% | 0.01% |  |
| D | 17236 | 15043 | 72 | 72 | 0.42% | 0.48% |  |
Top three noisy pixels from each quadrant. If the there are fewer than three noisy pixels in the level2.evt file, extra rows are filled as -1
| Pixel properties | Quadrant properties | ||||||
|---|---|---|---|---|---|---|---|
| Quadrant | DetID | PixID | Counts | Sigma | Mean | Median | Sigma |
| A | 12 | 189 | 77608 | 449.0 | 763 | 747 | 171.2 |
| A | 15 | 69 | 15235 | 84.63 | 763 | 747 | 171.2 |
| A | 8 | 15 | 12534 | 68.86 | 763 | 747 | 171.2 |
| B | 0 | 182 | 425242 | 2843.5 | 758 | 736 | 149.3 |
| B | 0 | 229 | 226810 | 1514.33 | 758 | 736 | 149.3 |
| B | 0 | 219 | 54387 | 359.37 | 758 | 736 | 149.3 |
| C | 3 | 233 | 1186841 | 7269.09 | 732 | 719 | 163.2 |
| C | 10 | 22 | 8658 | 48.65 | 732 | 719 | 163.2 |
| C | 14 | 234 | 8558 | 48.04 | 732 | 719 | 163.2 |
| D | 1 | 52 | 492576 | 2777.83 | 734 | 711 | 177.1 |
| D | 2 | 120 | 253003 | 1424.83 | 734 | 711 | 177.1 |
| D | 12 | 110 | 142663 | 801.68 | 734 | 711 | 177.1 |
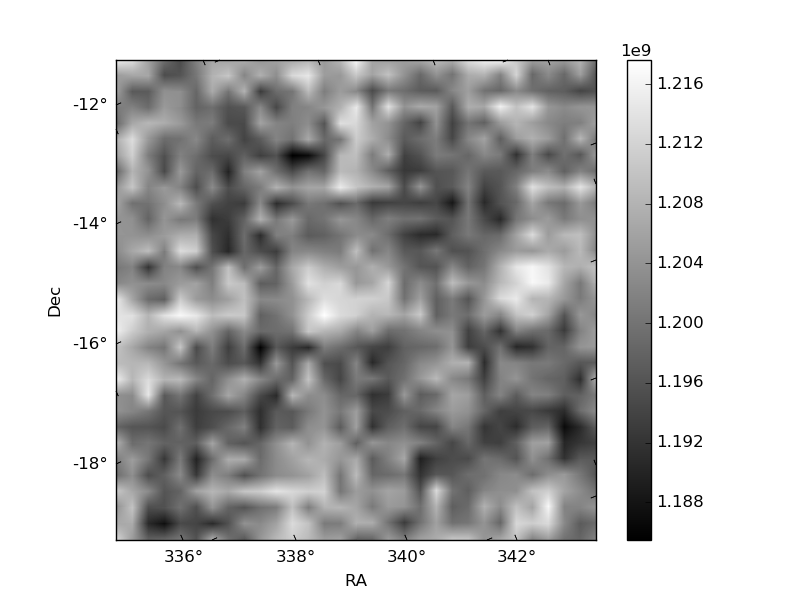
Histogram calculated using DETX and DETY for each event in the final _common_clean file
| Quadrant A |  |
 |
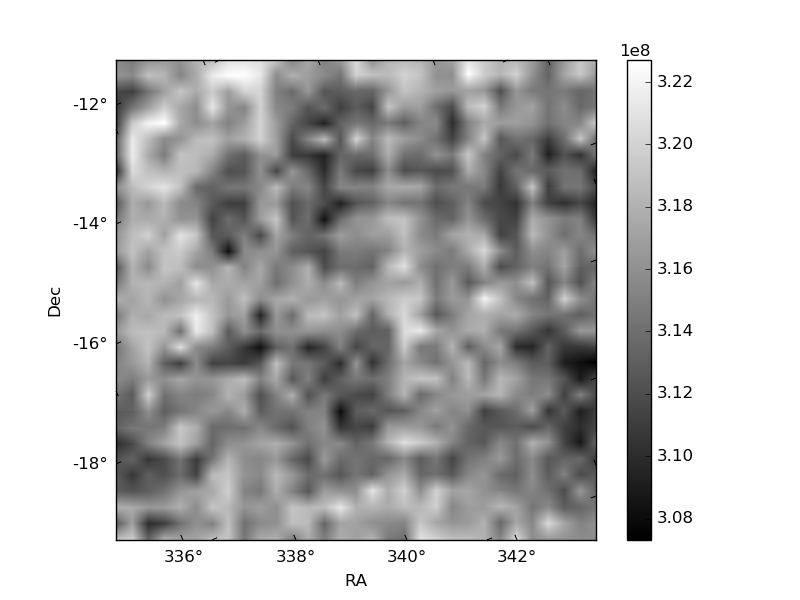
Quadrant B |
|---|---|---|---|
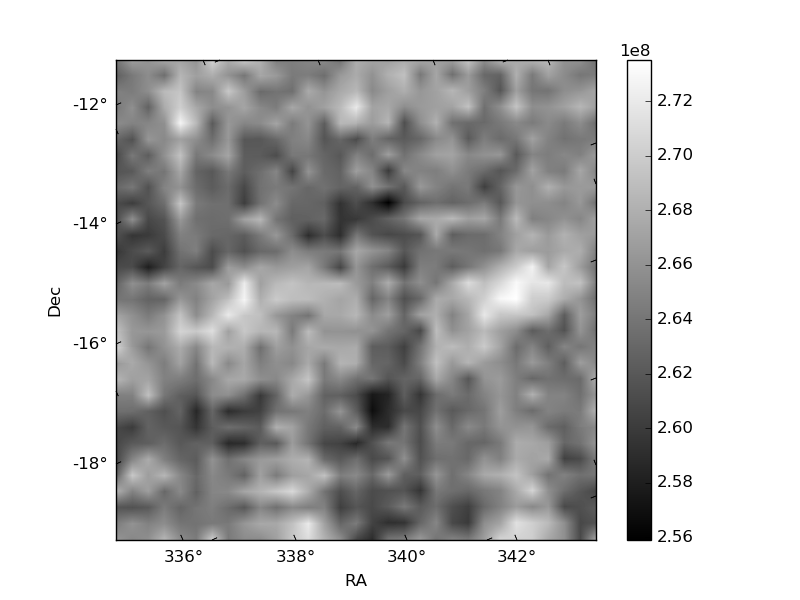
| Quadrant D |  |
 |
Quadrant C |
| Plot type | Count rate plots | Images |
|---|---|---|
| Comparison with Poisson distribution Blue bars denote a histogram of data divided into 1 sec bins. Red curve is a Poisson curve with rate = median count rate of data. |
 |
 |
| Quadrant-wise count rates Data is divided into 100 sec bins |
 |
|
| Module-wise count rates for Quadrant A Data is divided into 100 sec bins |
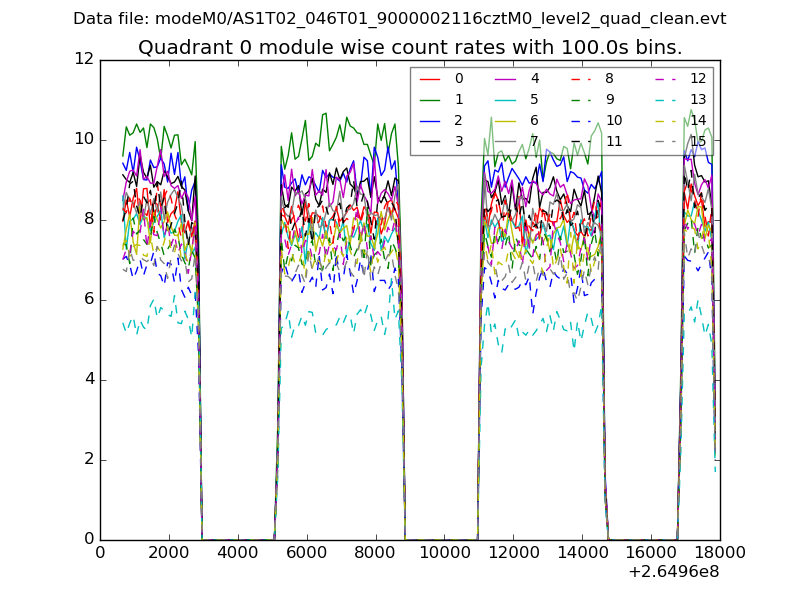 |
 |
| Module-wise count rates for Quadrant B Data is divided into 100 sec bins |
 |
 |
| Module-wise count rates for Quadrant C Data is divided into 100 sec bins |
 |
 |
| Module-wise count rates for Quadrant D Data is divided into 100 sec bins |
 |
 |
| Parameter | Plot |
|---|---|
| CZT HV Monitor |  |
| D_VDD |  |
| Temperature 1 |  |
| Veto HV Monitor |  |
| Veto LLD | 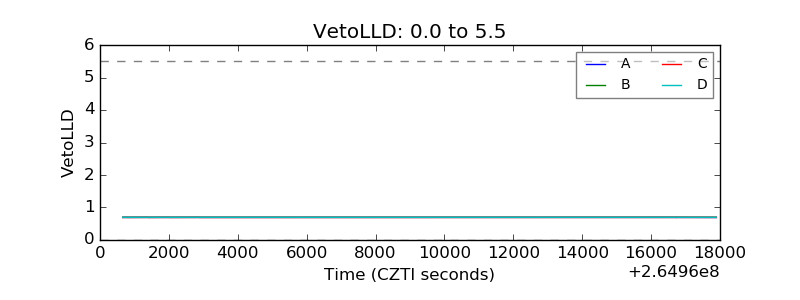 |
| Alpha Counter |  |
| _CPM_Rate |  |
| CZT Counter | 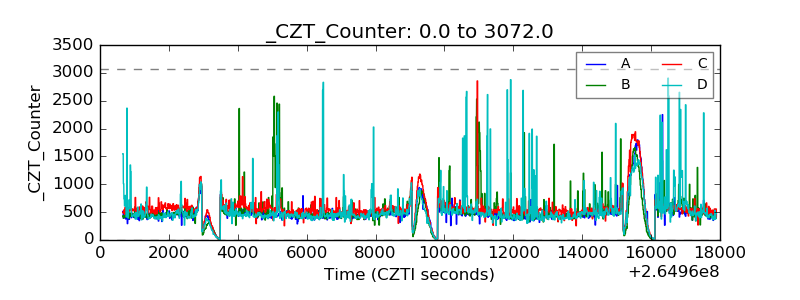 |
| +2.5 Volts monitor |  |
| +5 Volts monitor |  |
| _ROLL_ROT |  |
| _Roll_DEC |  |
| _Roll_RA |  |
| Veto Counter |  |