| Param | Original file | Final file |
|---|---|---|
| Filename | modeM0/AS1A04_149T01_9000002118cztM0_level2_bc.evt | modeM0/AS1A04_149T01_9000002118cztM0_level2_quad_clean.evt |
| Size (bytes) | 2,850,624,000 | 1,042,312,320 |
| Size | 2.7 GB | 994.0 MB |
| Events in quadrant A | 15,727,264 | 6,726,666 |
| Events in quadrant B | 18,422,077 | 6,741,746 |
| Events in quadrant C | 21,138,264 | 6,649,290 |
| Events in quadrant D | 25,974,341 | 6,350,370 |
| Mode M9 | |||
|---|---|---|---|
| Quadrant | BADHDUFLAG | Total packets | Discarded packets |
| A | 0 | 121 | 0 |
| B | 0 | 121 | 0 |
| C | 0 | 121 | 0 |
| D | 0 | 121 | 0 |
| Mode SS | |||
|---|---|---|---|
| Quadrant | BADHDUFLAG | Total packets | Discarded packets |
| A | 0 | 1516 | 0 |
| B | 0 | 1516 | 0 |
| C | 0 | 1516 | 0 |
| D | 0 | 1516 | 0 |
| Mode M0 | |||
|---|---|---|---|
| Quadrant | BADHDUFLAG | Total packets | Discarded packets |
| A | 0 | 153588 | 0 |
| B | 0 | 164209 | 0 |
| C | 0 | 169201 | 0 |
| D | 0 | 185004 | 0 |
| Quadrant | Total seconds | Saturated seconds | Saturation percentage |
|---|---|---|---|
| A | 74438 | 886 | 1.190252% |
| B | 74438 | 1643 | 2.207206% |
| C | 74438 | 720 | 0.967248% |
| D | 74438 | 2971 | 3.991241% |
Noise dominated data is calculated using 1-second bins in cleaned event files. If a bin has >2000 counts, and if more than 50% of those come from <1% of pixels, then it is considered to be noise-dominated and hence unusable.
| Quadrant | # 1 sec bins | Bins with >0 counts | Bins with >2000 counts | High rate bins dominated by noise | Noise dominated (total time) | Noise dominated (detector-on time) | Marked lightcurve |
|---|---|---|---|---|---|---|---|
| A | 86480 | 74438 | 3 | 3 | 0.00% | 0.00% | 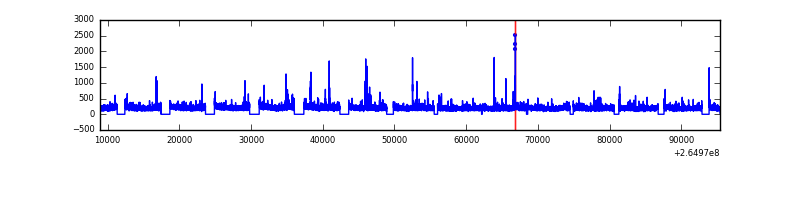 |
| B | 86480 | 74436 | 32 | 32 | 0.04% | 0.04% |  |
| C | 86480 | 74437 | 4 | 4 | 0.00% | 0.01% |  |
| D | 86479 | 74435 | 1403 | 1403 | 1.62% | 1.88% | 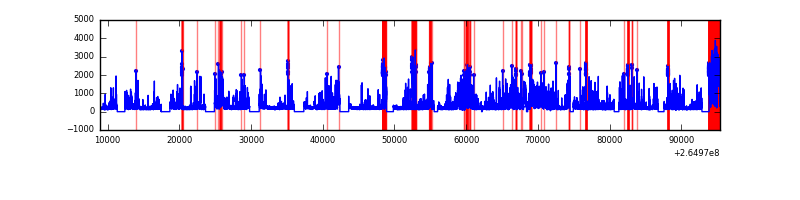 |
Top three noisy pixels from each quadrant. If the there are fewer than three noisy pixels in the level2.evt file, extra rows are filled as -1
| Pixel properties | Quadrant properties | ||||||
|---|---|---|---|---|---|---|---|
| Quadrant | DetID | PixID | Counts | Sigma | Mean | Median | Sigma |
| A | 12 | 189 | 304978 | 354.28 | 3897 | 3826 | 850.0 |
| A | 8 | 15 | 256860 | 297.67 | 3897 | 3826 | 850.0 |
| A | 9 | 143 | 69591 | 77.37 | 3897 | 3826 | 850.0 |
| B | 0 | 229 | 957343 | 1286.14 | 3920 | 3818 | 741.4 |
| B | 0 | 182 | 735394 | 986.77 | 3920 | 3818 | 741.4 |
| B | 10 | 245 | 368185 | 491.47 | 3920 | 3818 | 741.4 |
| C | 3 | 233 | 6039325 | 7204.57 | 3818 | 3784 | 837.7 |
| C | 3 | 232 | 50369 | 55.61 | 3818 | 3784 | 837.7 |
| C | 14 | 234 | 32375 | 34.13 | 3818 | 3784 | 837.7 |
| D | 12 | 110 | 5257278 | 5970.75 | 3783 | 3682 | 879.9 |
| D | 1 | 52 | 3259719 | 3700.51 | 3783 | 3682 | 879.9 |
| D | 2 | 120 | 957623 | 1084.16 | 3783 | 3682 | 879.9 |
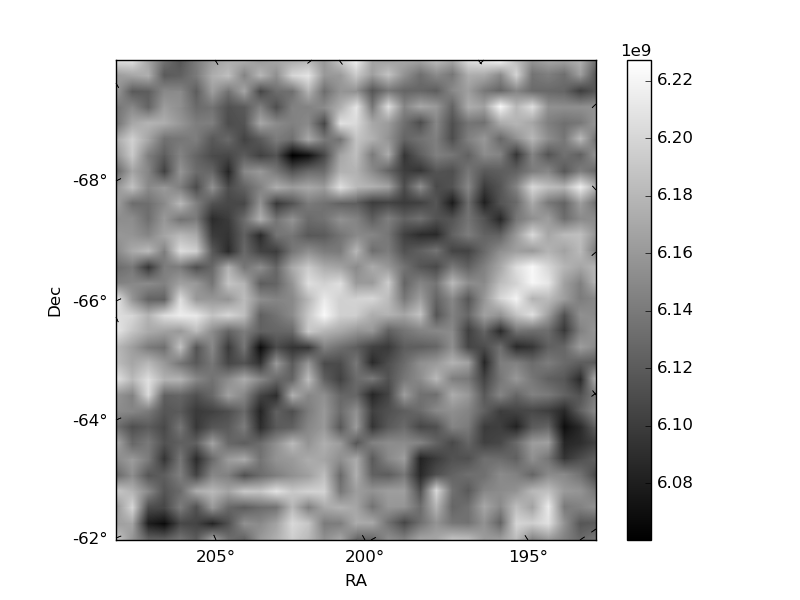
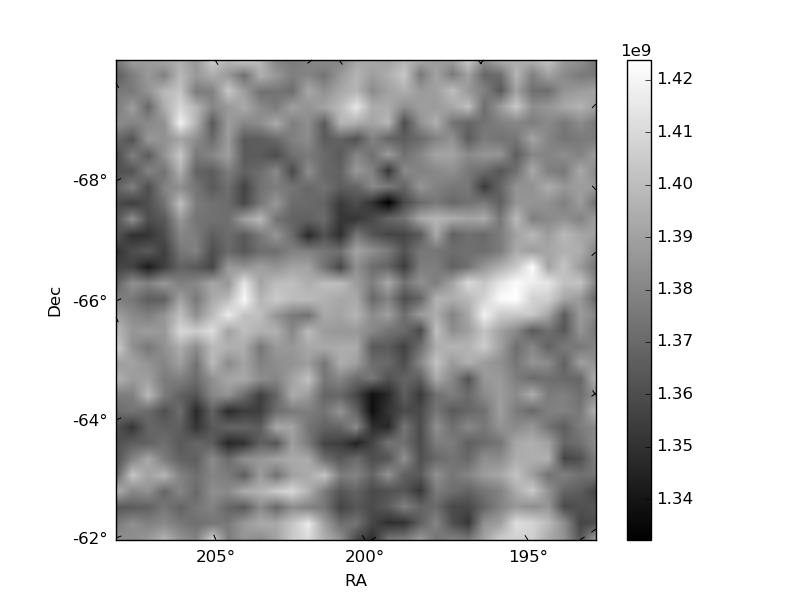
Histogram calculated using DETX and DETY for each event in the final _common_clean file
| Quadrant A | 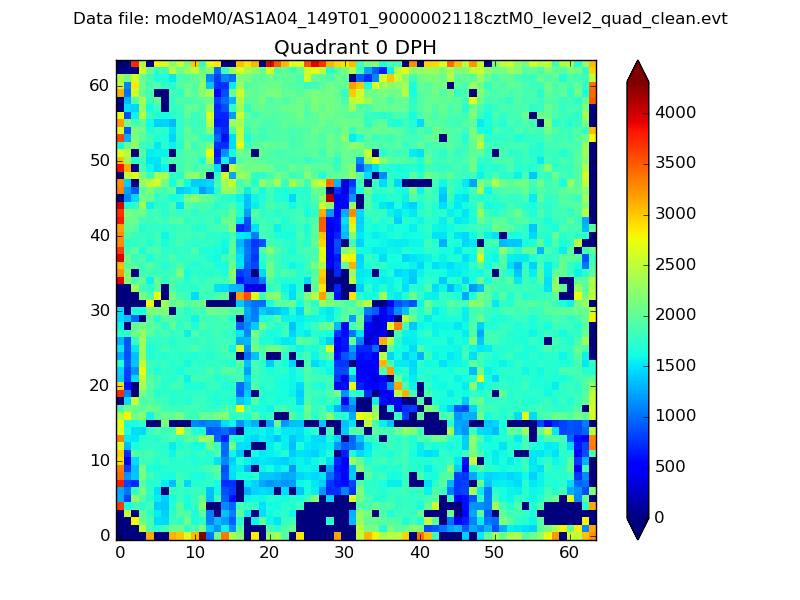 |
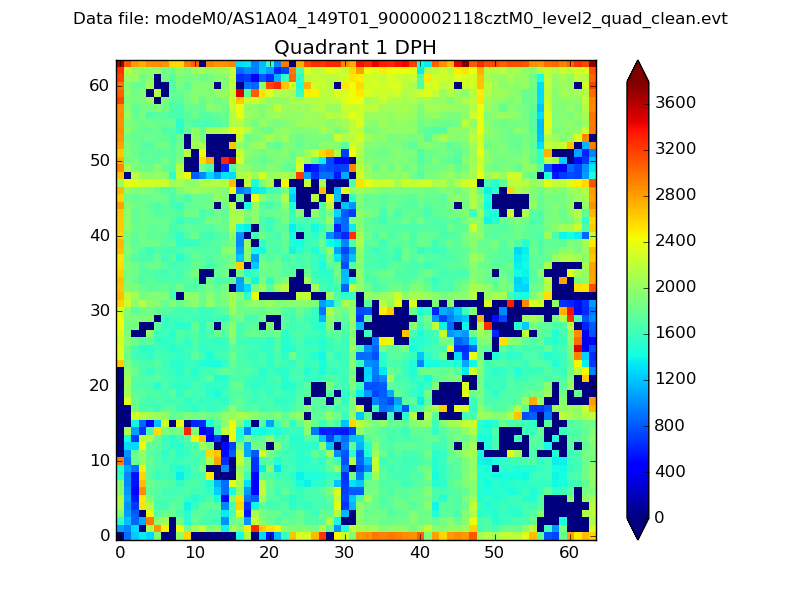 |
Quadrant B |
|---|---|---|---|
| Quadrant D |  |
 |
Quadrant C |
| Plot type | Count rate plots | Images |
|---|---|---|
| Comparison with Poisson distribution Blue bars denote a histogram of data divided into 1 sec bins. Red curve is a Poisson curve with rate = median count rate of data. |
 |
 |
| Quadrant-wise count rates Data is divided into 100 sec bins |
 |
|
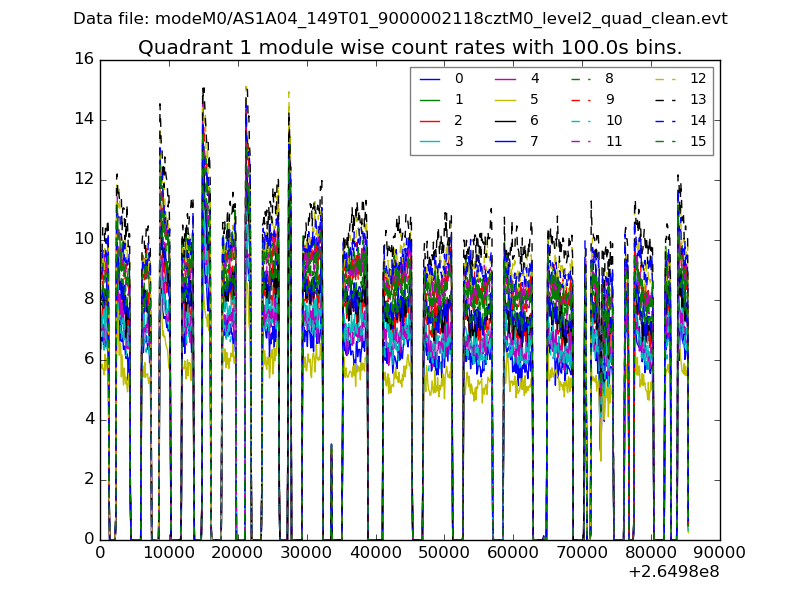
| Module-wise count rates for Quadrant A Data is divided into 100 sec bins |
 |
 |
| Module-wise count rates for Quadrant B Data is divided into 100 sec bins |
 |
 |
| Module-wise count rates for Quadrant C Data is divided into 100 sec bins |
 |
 |
| Module-wise count rates for Quadrant D Data is divided into 100 sec bins |
 |
 |
| Parameter | Plot |
|---|---|
| CZT HV Monitor |  |
| D_VDD |  |
| Temperature 1 |  |
| Veto HV Monitor |  |
| Veto LLD | 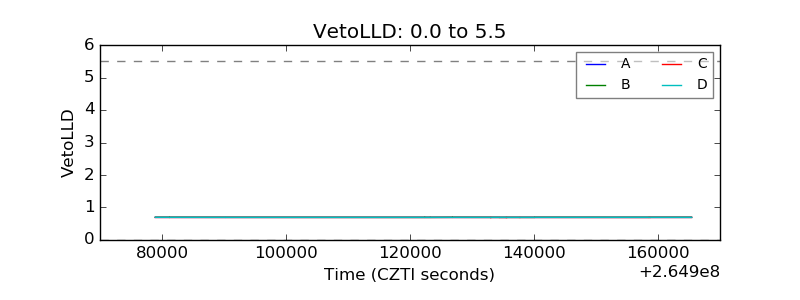 |
| Alpha Counter |  |
| _CPM_Rate |  |
| CZT Counter |  |
| +2.5 Volts monitor | 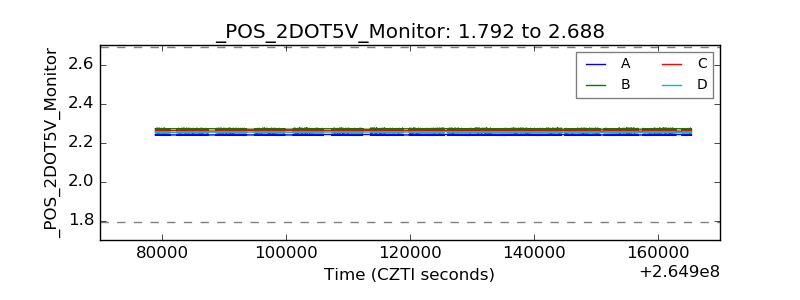 |
| +5 Volts monitor |  |
| _ROLL_ROT |  |
| _Roll_DEC |  |
| _Roll_RA |  |
| Veto Counter |  |