| Param | Original file | Final file |
|---|---|---|
| Filename | modeM0/AS1G08_028T01_9000002112cztM0_level2_bc.evt | modeM0/AS1G08_028T01_9000002112cztM0_level2_quad_clean.evt |
| Size (bytes) | 1,077,079,680 | 356,832,000 |
| Size | 1.0 GB | 340.3 MB |
| Events in quadrant A | 5,808,161 | 2,292,484 |
| Events in quadrant B | 7,571,552 | 2,259,048 |
| Events in quadrant C | 6,801,054 | 2,244,978 |
| Events in quadrant D | 10,595,785 | 2,156,501 |
| Mode M9 | |||
|---|---|---|---|
| Quadrant | BADHDUFLAG | Total packets | Discarded packets |
| A | 0 | 25 | 0 |
| B | 0 | 25 | 0 |
| C | 0 | 25 | 0 |
| D | 0 | 25 | 0 |
| Mode SS | |||
|---|---|---|---|
| Quadrant | BADHDUFLAG | Total packets | Discarded packets |
| A | 0 | 548 | 0 |
| B | 0 | 548 | 0 |
| C | 0 | 548 | 0 |
| D | 0 | 548 | 0 |
| Mode M0 | |||
|---|---|---|---|
| Quadrant | BADHDUFLAG | Total packets | Discarded packets |
| A | 0 | 56489 | 0 |
| B | 0 | 64286 | 0 |
| C | 0 | 57849 | 0 |
| D | 0 | 75631 | 0 |
| Quadrant | Total seconds | Saturated seconds | Saturation percentage |
|---|---|---|---|
| A | 26980 | 316 | 1.171238% |
| B | 26980 | 1090 | 4.040030% |
| C | 26980 | 305 | 1.130467% |
| D | 26980 | 1742 | 6.456635% |
Noise dominated data is calculated using 1-second bins in cleaned event files. If a bin has >2000 counts, and if more than 50% of those come from <1% of pixels, then it is considered to be noise-dominated and hence unusable.
| Quadrant | # 1 sec bins | Bins with >0 counts | Bins with >2000 counts | High rate bins dominated by noise | Noise dominated (total time) | Noise dominated (detector-on time) | Marked lightcurve |
|---|---|---|---|---|---|---|---|
| A | 29411 | 26978 | 20 | 20 | 0.07% | 0.07% |  |
| B | 29411 | 26976 | 117 | 117 | 0.40% | 0.43% |  |
| C | 29411 | 26980 | 8 | 8 | 0.03% | 0.03% |  |
| D | 29411 | 26977 | 125 | 125 | 0.43% | 0.46% |  |
Top three noisy pixels from each quadrant. If the there are fewer than three noisy pixels in the level2.evt file, extra rows are filled as -1
| Pixel properties | Quadrant properties | ||||||
|---|---|---|---|---|---|---|---|
| Quadrant | DetID | PixID | Counts | Sigma | Mean | Median | Sigma |
| A | 12 | 189 | 299047 | 975.23 | 1361 | 1330 | 305.3 |
| A | 4 | 2 | 190387 | 619.29 | 1361 | 1330 | 305.3 |
| A | 8 | 15 | 52687 | 168.23 | 1361 | 1330 | 305.3 |
| B | 10 | 16 | 1292995 | 4932.8 | 1341 | 1303 | 261.9 |
| B | 0 | 229 | 460045 | 1751.88 | 1341 | 1303 | 261.9 |
| B | 0 | 85 | 194793 | 738.91 | 1341 | 1303 | 261.9 |
| C | 3 | 233 | 1454050 | 4936.45 | 1319 | 1299 | 294.3 |
| C | 6 | 96 | 159134 | 536.32 | 1319 | 1299 | 294.3 |
| C | 14 | 234 | 20476 | 65.16 | 1319 | 1299 | 294.3 |
| D | 13 | 122 | 1573798 | 5139.65 | 1296 | 1257 | 306.0 |
| D | 5 | 222 | 1412476 | 4612.39 | 1296 | 1257 | 306.0 |
| D | 2 | 120 | 722882 | 2358.54 | 1296 | 1257 | 306.0 |
Histogram calculated using DETX and DETY for each event in the final _common_clean file
| Quadrant A |  |
 |
Quadrant B |
|---|---|---|---|
| Quadrant D |  |
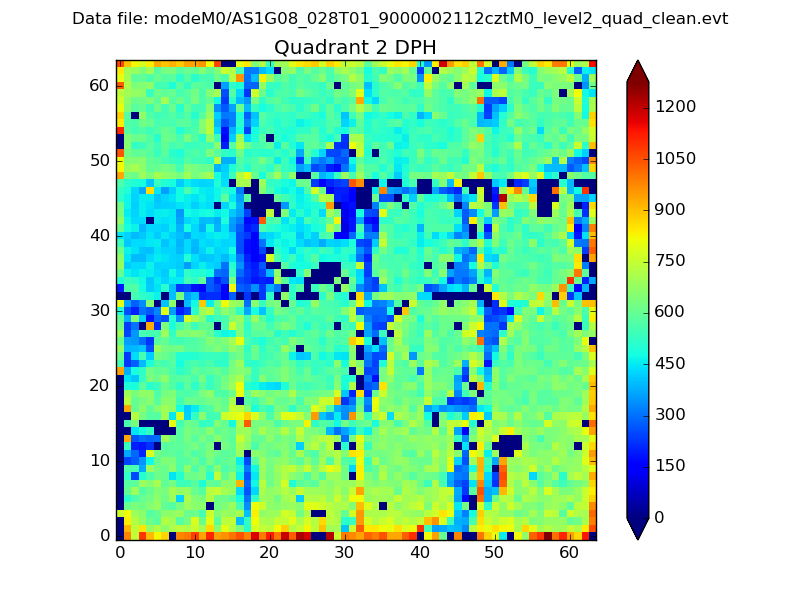 |
Quadrant C |
| Plot type | Count rate plots | Images |
|---|---|---|
| Comparison with Poisson distribution Blue bars denote a histogram of data divided into 1 sec bins. Red curve is a Poisson curve with rate = median count rate of data. |
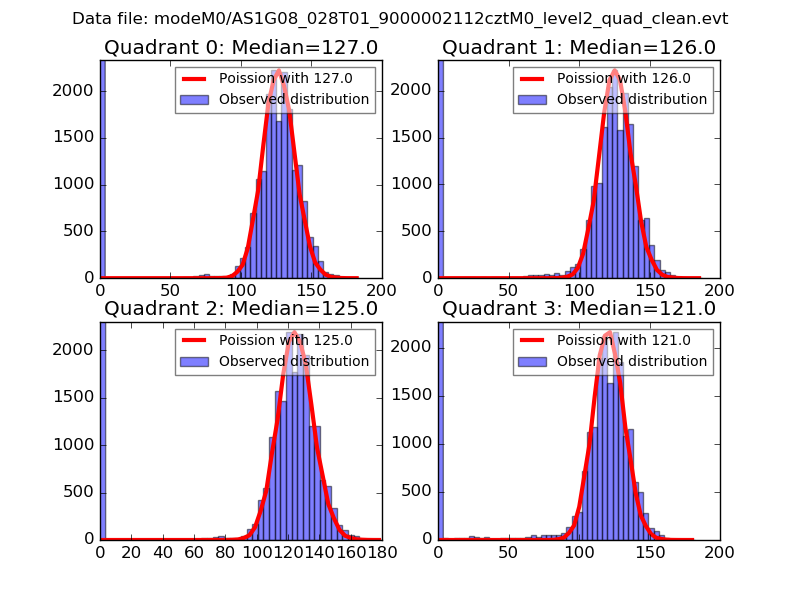 |
 |
| Quadrant-wise count rates Data is divided into 100 sec bins |
 |
|
| Module-wise count rates for Quadrant A Data is divided into 100 sec bins |
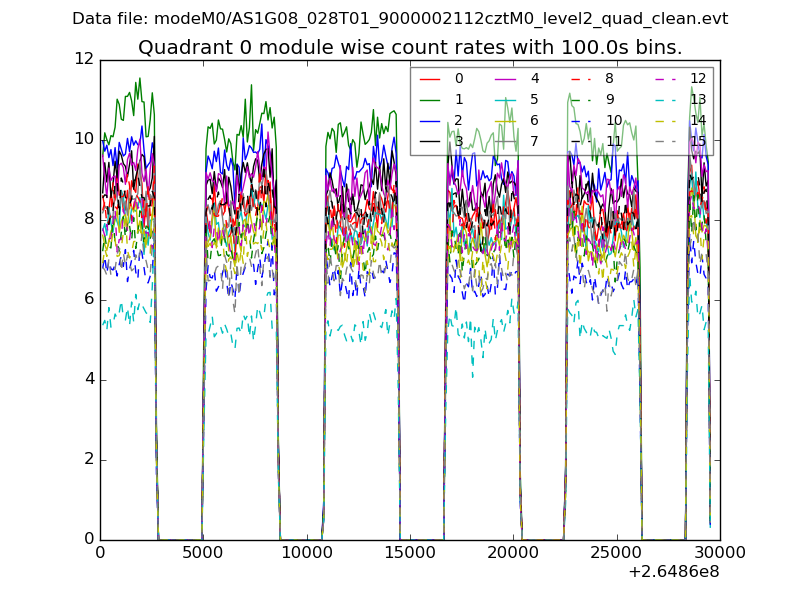 |
 |
| Module-wise count rates for Quadrant B Data is divided into 100 sec bins |
 |
 |
| Module-wise count rates for Quadrant C Data is divided into 100 sec bins |
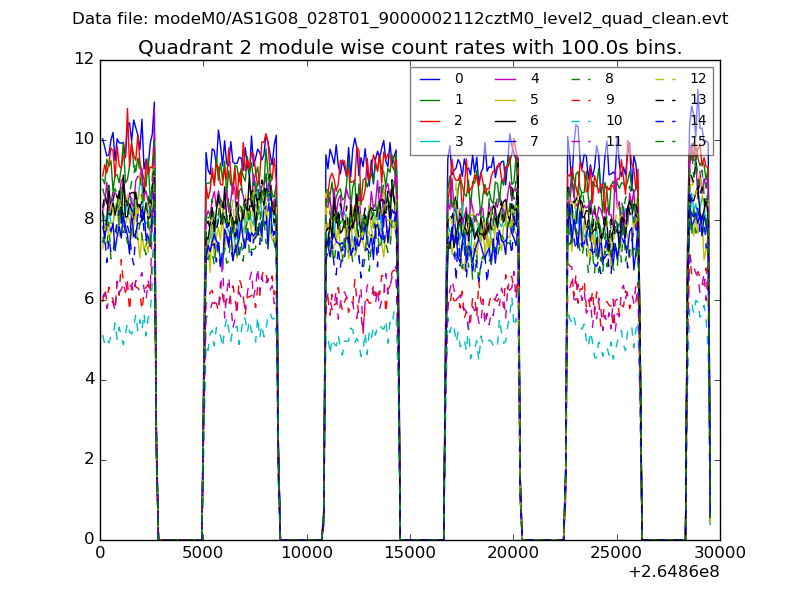 |
 |
| Module-wise count rates for Quadrant D Data is divided into 100 sec bins |
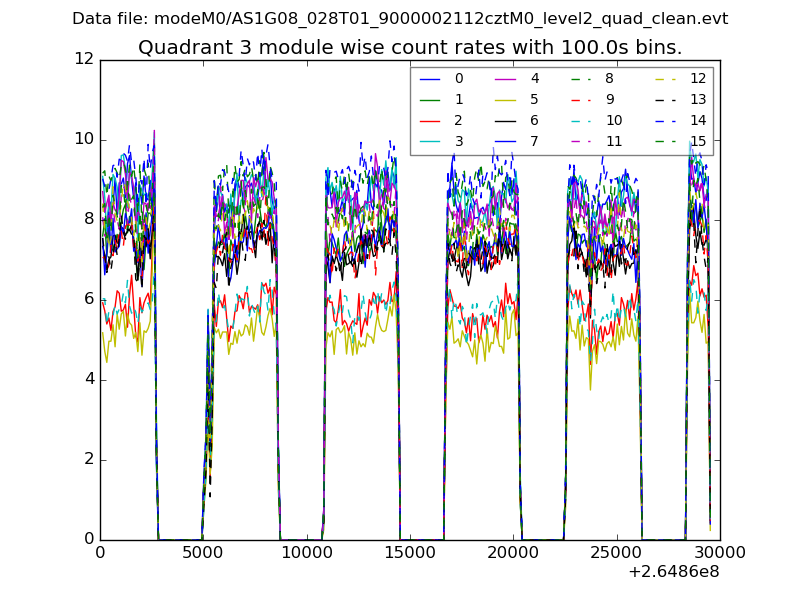 |
 |
| Parameter | Plot |
|---|---|
| CZT HV Monitor |  |
| D_VDD |  |
| Temperature 1 |  |
| Veto HV Monitor |  |
| Veto LLD |  |
| Alpha Counter |  |
| _CPM_Rate |  |
| CZT Counter |  |
| +2.5 Volts monitor |  |
| +5 Volts monitor |  |
| _ROLL_ROT |  |
| _Roll_DEC |  |
| _Roll_RA |  |
| Veto Counter |  |