| Param | Original file | Final file |
|---|---|---|
| Filename | modeM0/AS1A04_048T01_9000002114cztM0_level2_bc.evt | modeM0/AS1A04_048T01_9000002114cztM0_level2_quad_clean.evt |
| Size (bytes) | 2,378,079,360 | 745,392,960 |
| Size | 2.2 GB | 710.9 MB |
| Events in quadrant A | 13,555,449 | 4,732,151 |
| Events in quadrant B | 15,808,900 | 4,736,900 |
| Events in quadrant C | 17,454,343 | 4,632,395 |
| Events in quadrant D | 21,214,330 | 4,459,248 |
| Mode SS | |||
|---|---|---|---|
| Quadrant | BADHDUFLAG | Total packets | Discarded packets |
| A | 0 | 1196 | 0 |
| B | 0 | 1196 | 0 |
| C | 0 | 1196 | 0 |
| D | 0 | 1196 | 0 |
| Mode M9 | |||
|---|---|---|---|
| Quadrant | BADHDUFLAG | Total packets | Discarded packets |
| A | 0 | 97 | 0 |
| B | 0 | 97 | 0 |
| C | 0 | 97 | 0 |
| D | 0 | 97 | 0 |
| Mode M0 | |||
|---|---|---|---|
| Quadrant | BADHDUFLAG | Total packets | Discarded packets |
| A | 0 | 124237 | 0 |
| B | 0 | 134542 | 0 |
| C | 0 | 138847 | 0 |
| D | 0 | 151762 | 0 |
| Quadrant | Total seconds | Saturated seconds | Saturation percentage |
|---|---|---|---|
| A | 58547 | 783 | 1.337387% |
| B | 58547 | 1727 | 2.949767% |
| C | 58547 | 680 | 1.161460% |
| D | 58547 | 1965 | 3.356278% |
Noise dominated data is calculated using 1-second bins in cleaned event files. If a bin has >2000 counts, and if more than 50% of those come from <1% of pixels, then it is considered to be noise-dominated and hence unusable.
| Quadrant | # 1 sec bins | Bins with >0 counts | Bins with >2000 counts | High rate bins dominated by noise | Noise dominated (total time) | Noise dominated (detector-on time) | Marked lightcurve |
|---|---|---|---|---|---|---|---|
| A | 68384 | 58546 | 9 | 9 | 0.01% | 0.02% |  |
| B | 68384 | 58543 | 143 | 143 | 0.21% | 0.24% | 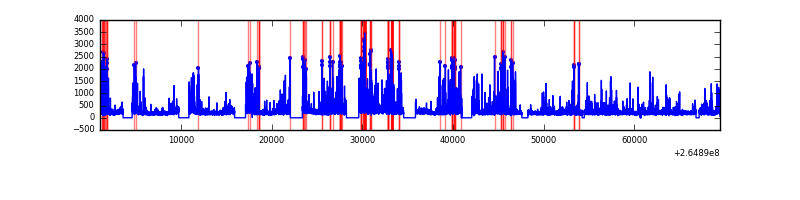 |
| C | 68384 | 58545 | 8 | 8 | 0.01% | 0.01% | 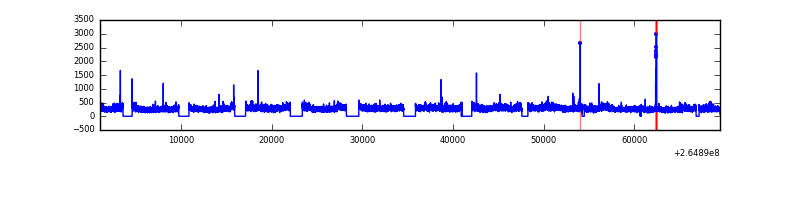 |
| D | 68384 | 58545 | 334 | 334 | 0.49% | 0.57% | 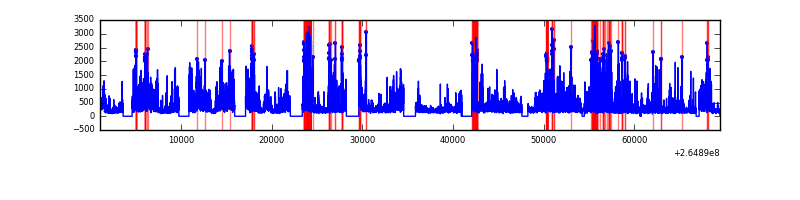 |
Top three noisy pixels from each quadrant. If the there are fewer than three noisy pixels in the level2.evt file, extra rows are filled as -1
| Pixel properties | Quadrant properties | ||||||
|---|---|---|---|---|---|---|---|
| Quadrant | DetID | PixID | Counts | Sigma | Mean | Median | Sigma |
| A | 12 | 189 | 1409170 | 2072.41 | 3116 | 3058 | 678.5 |
| A | 8 | 15 | 52835 | 73.36 | 3116 | 3058 | 678.5 |
| A | 13 | 254 | 31279 | 41.59 | 3116 | 3058 | 678.5 |
| B | 10 | 16 | 1720552 | 2893.97 | 3130 | 3049 | 593.5 |
| B | 0 | 229 | 935871 | 1571.79 | 3130 | 3049 | 593.5 |
| B | 0 | 189 | 219576 | 364.85 | 3130 | 3049 | 593.5 |
| C | 3 | 233 | 5408318 | 8195.82 | 3039 | 3003 | 659.5 |
| C | 3 | 232 | 55400 | 79.45 | 3039 | 3003 | 659.5 |
| C | 14 | 234 | 48492 | 68.97 | 3039 | 3003 | 659.5 |
| D | 5 | 222 | 3248667 | 4674.67 | 3017 | 2936 | 694.3 |
| D | 12 | 110 | 2848879 | 4098.87 | 3017 | 2936 | 694.3 |
| D | 1 | 52 | 1664988 | 2393.77 | 3017 | 2936 | 694.3 |
Histogram calculated using DETX and DETY for each event in the final _common_clean file
| Quadrant A |  |
 |
Quadrant B |
|---|---|---|---|
| Quadrant D |  |
 |
Quadrant C |
| Plot type | Count rate plots | Images |
|---|---|---|
| Comparison with Poisson distribution Blue bars denote a histogram of data divided into 1 sec bins. Red curve is a Poisson curve with rate = median count rate of data. |
 |
 |
| Quadrant-wise count rates Data is divided into 100 sec bins |
 |
|
| Module-wise count rates for Quadrant A Data is divided into 100 sec bins |
 |
 |
| Module-wise count rates for Quadrant B Data is divided into 100 sec bins |
 |
 |
| Module-wise count rates for Quadrant C Data is divided into 100 sec bins |
 |
 |
| Module-wise count rates for Quadrant D Data is divided into 100 sec bins |
 |
 |
| Parameter | Plot |
|---|---|
| CZT HV Monitor | 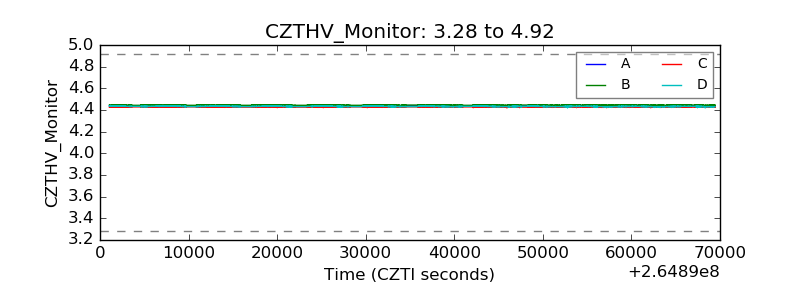 |
| D_VDD |  |
| Temperature 1 |  |
| Veto HV Monitor | 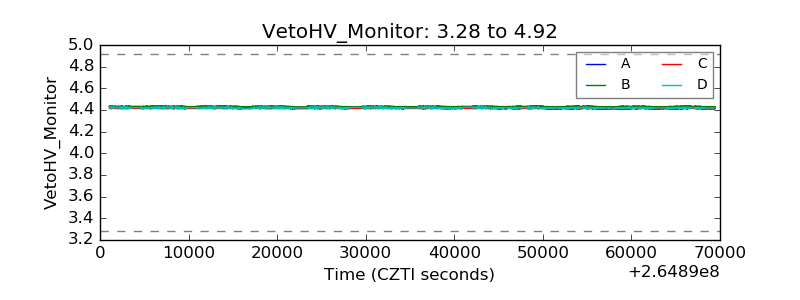 |
| Veto LLD |  |
| Alpha Counter | 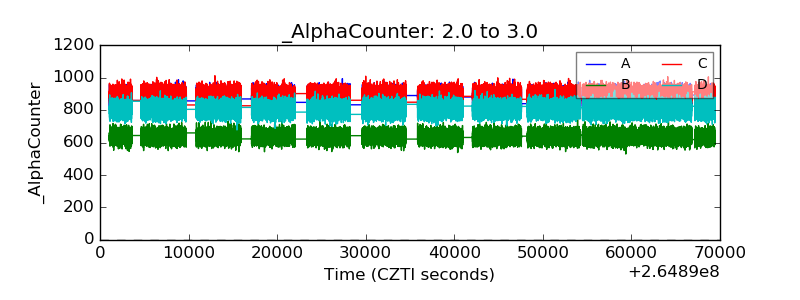 |
| _CPM_Rate |  |
| CZT Counter |  |
| +2.5 Volts monitor |  |
| +5 Volts monitor |  |
| _ROLL_ROT |  |
| _Roll_DEC |  |
| _Roll_RA |  |
| Veto Counter |  |