| Param | Original file | Final file |
|---|---|---|
| Filename | modeM0/AS1G08_078T01_9000002110cztM0_level2_bc.evt | modeM0/AS1G08_078T01_9000002110cztM0_level2_quad_clean.evt |
| Size (bytes) | 8,059,910,400 | 2,534,129,280 |
| Size | 7.5 GB | 2.4 GB |
| Events in quadrant A | 46,576,819 | 16,094,089 |
| Events in quadrant B | 59,722,717 | 15,847,680 |
| Events in quadrant C | 49,993,560 | 15,797,386 |
| Events in quadrant D | 74,161,385 | 15,282,060 |
| Mode SS | |||
|---|---|---|---|
| Quadrant | BADHDUFLAG | Total packets | Discarded packets |
| A | 0 | 4092 | 0 |
| B | 0 | 4092 | 0 |
| C | 0 | 4092 | 0 |
| D | 0 | 4092 | 0 |
| Mode M0 | |||
|---|---|---|---|
| Quadrant | BADHDUFLAG | Total packets | Discarded packets |
| A | 0 | 426015 | 0 |
| B | 0 | 486671 | 0 |
| C | 0 | 424995 | 0 |
| D | 0 | 525180 | 0 |
| Mode M9 | |||
|---|---|---|---|
| Quadrant | BADHDUFLAG | Total packets | Discarded packets |
| A | 0 | 321 | 0 |
| B | 0 | 321 | 0 |
| C | 0 | 321 | 0 |
| D | 0 | 322 | 0 |
| Quadrant | Total seconds | Saturated seconds | Saturation percentage |
|---|---|---|---|
| A | 200528 | 2175 | 1.084637% |
| B | 200530 | 10281 | 5.126914% |
| C | 200528 | 1606 | 0.800886% |
| D | 200529 | 6873 | 3.427434% |
Noise dominated data is calculated using 1-second bins in cleaned event files. If a bin has >2000 counts, and if more than 50% of those come from <1% of pixels, then it is considered to be noise-dominated and hence unusable.
| Quadrant | # 1 sec bins | Bins with >0 counts | Bins with >2000 counts | High rate bins dominated by noise | Noise dominated (total time) | Noise dominated (detector-on time) | Marked lightcurve |
|---|---|---|---|---|---|---|---|
| A | 243858 | 200522 | 51 | 51 | 0.02% | 0.03% |  |
| B | 243858 | 200515 | 753 | 753 | 0.31% | 0.38% |  |
| C | 243858 | 200530 | 9 | 9 | 0.00% | 0.00% |  |
| D | 243858 | 200523 | 783 | 783 | 0.32% | 0.39% |  |
Top three noisy pixels from each quadrant. If the there are fewer than three noisy pixels in the level2.evt file, extra rows are filled as -1
| Pixel properties | Quadrant properties | ||||||
|---|---|---|---|---|---|---|---|
| Quadrant | DetID | PixID | Counts | Sigma | Mean | Median | Sigma |
| A | 12 | 189 | 3616799 | 1572.57 | 10599 | 10409 | 2293.3 |
| A | 8 | 15 | 1472599 | 637.59 | 10599 | 10409 | 2293.3 |
| A | 9 | 143 | 287053 | 120.63 | 10599 | 10409 | 2293.3 |
| B | 10 | 245 | 12764716 | 6426.04 | 10420 | 10145 | 1984.8 |
| B | 0 | 229 | 2475318 | 1242.01 | 10420 | 10145 | 1984.8 |
| B | 10 | 16 | 1574395 | 788.1 | 10420 | 10145 | 1984.8 |
| C | 3 | 233 | 9673069 | 4314.42 | 10239 | 10125 | 2239.7 |
| C | 14 | 220 | 156037 | 65.15 | 10239 | 10125 | 2239.7 |
| C | 10 | 22 | 73690 | 28.38 | 10239 | 10125 | 2239.7 |
| D | 5 | 222 | 10167989 | 4290.15 | 10221 | 9935 | 2367.8 |
| D | 12 | 110 | 6750378 | 2846.76 | 10221 | 9935 | 2367.8 |
| D | 1 | 52 | 6139452 | 2588.74 | 10221 | 9935 | 2367.8 |
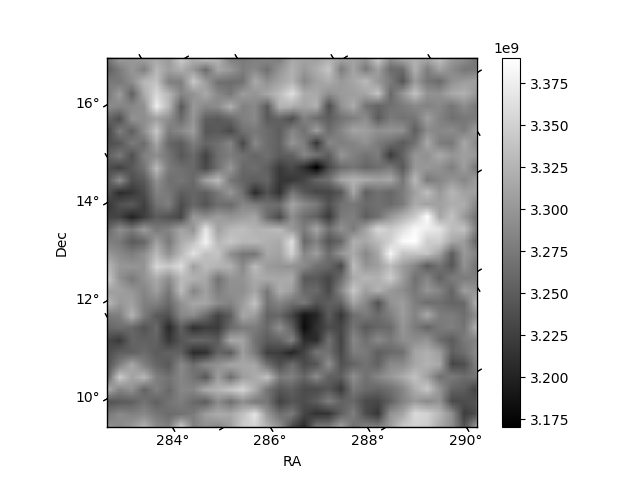
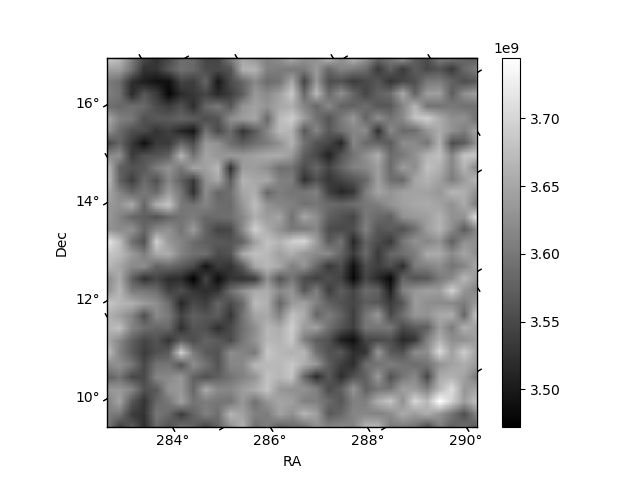
Histogram calculated using DETX and DETY for each event in the final _common_clean file
| Quadrant A |  |
 |
Quadrant B |
|---|---|---|---|
| Quadrant D |  |
 |
Quadrant C |
| Plot type | Count rate plots | Images |
|---|---|---|
| Comparison with Poisson distribution Blue bars denote a histogram of data divided into 1 sec bins. Red curve is a Poisson curve with rate = median count rate of data. |
 |
 |
| Quadrant-wise count rates Data is divided into 100 sec bins |
 |
|
| Module-wise count rates for Quadrant A Data is divided into 100 sec bins |
 |
 |
| Module-wise count rates for Quadrant B Data is divided into 100 sec bins |
 |
 |
| Module-wise count rates for Quadrant C Data is divided into 100 sec bins |
 |
 |
| Module-wise count rates for Quadrant D Data is divided into 100 sec bins |
 |
 |
| Parameter | Plot |
|---|---|
| CZT HV Monitor |  |
| D_VDD |  |
| Temperature 1 | 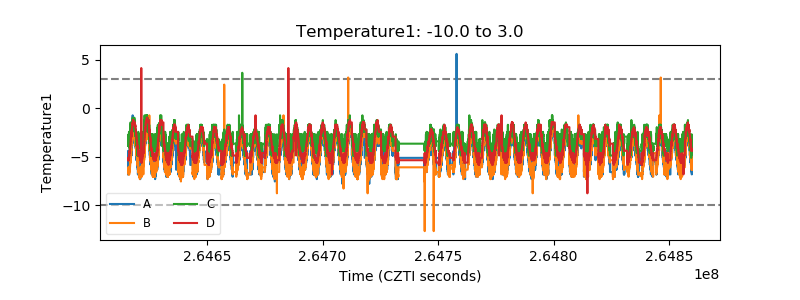 |
| Veto HV Monitor | 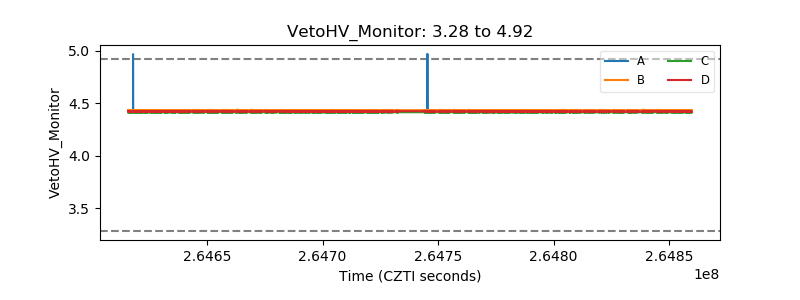 |
| Veto LLD |  |
| Alpha Counter |  |
| _CPM_Rate | 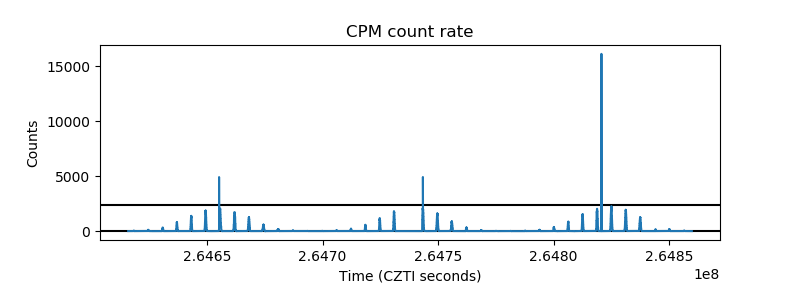 |
| CZT Counter |  |
| +2.5 Volts monitor |  |
| +5 Volts monitor | 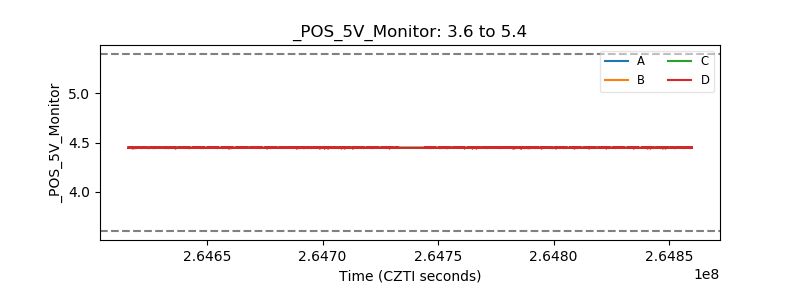 |
| _ROLL_ROT |  |
| _Roll_DEC |  |
| _Roll_RA | 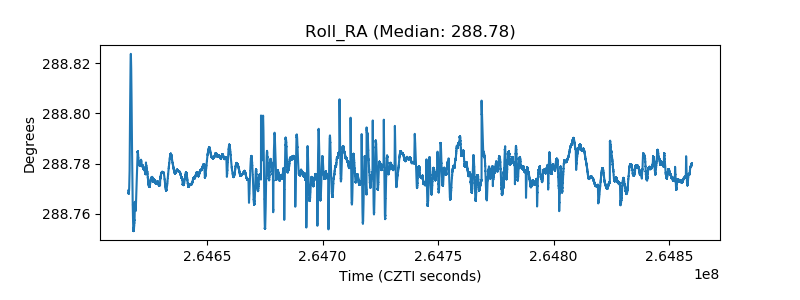 |
| Veto Counter |  |