| Param | Original file | Final file |
|---|---|---|
| Filename | modeM0/AS1A04_231T01_9000002106cztM0_level2_bc.evt | modeM0/AS1A04_231T01_9000002106cztM0_level2_quad_clean.evt |
| Size (bytes) | 2,490,696,000 | 801,512,640 |
| Size | 2.3 GB | 764.4 MB |
| Events in quadrant A | 13,232,389 | 5,180,515 |
| Events in quadrant B | 15,558,034 | 5,174,764 |
| Events in quadrant C | 15,954,586 | 5,105,880 |
| Events in quadrant D | 26,723,832 | 4,823,506 |
| Mode M9 | |||
|---|---|---|---|
| Quadrant | BADHDUFLAG | Total packets | Discarded packets |
| A | 0 | 86 | 0 |
| B | 0 | 86 | 0 |
| C | 0 | 86 | 0 |
| D | 0 | 86 | 0 |
| Mode SS | |||
|---|---|---|---|
| Quadrant | BADHDUFLAG | Total packets | Discarded packets |
| A | 0 | 1190 | 0 |
| B | 0 | 1190 | 0 |
| C | 0 | 1190 | 0 |
| D | 0 | 1190 | 0 |
| Mode M0 | |||
|---|---|---|---|
| Quadrant | BADHDUFLAG | Total packets | Discarded packets |
| A | 0 | 122068 | 0 |
| B | 0 | 133250 | 0 |
| C | 0 | 130848 | 0 |
| D | 0 | 173702 | 0 |
| Quadrant | Total seconds | Saturated seconds | Saturation percentage |
|---|---|---|---|
| A | 58182 | 471 | 0.809529% |
| B | 58182 | 1247 | 2.143275% |
| C | 58182 | 331 | 0.568904% |
| D | 58182 | 4176 | 7.177478% |
Noise dominated data is calculated using 1-second bins in cleaned event files. If a bin has >2000 counts, and if more than 50% of those come from <1% of pixels, then it is considered to be noise-dominated and hence unusable.
| Quadrant | # 1 sec bins | Bins with >0 counts | Bins with >2000 counts | High rate bins dominated by noise | Noise dominated (total time) | Noise dominated (detector-on time) | Marked lightcurve |
|---|---|---|---|---|---|---|---|
| A | 66988 | 58186 | 7 | 7 | 0.01% | 0.01% |  |
| B | 66988 | 58183 | 83 | 83 | 0.12% | 0.14% |  |
| C | 66988 | 58187 | 4 | 4 | 0.01% | 0.01% |  |
| D | 66988 | 58183 | 574 | 574 | 0.86% | 0.99% |  |
Top three noisy pixels from each quadrant. If the there are fewer than three noisy pixels in the level2.evt file, extra rows are filled as -1
| Pixel properties | Quadrant properties | ||||||
|---|---|---|---|---|---|---|---|
| Quadrant | DetID | PixID | Counts | Sigma | Mean | Median | Sigma |
| A | 12 | 189 | 809308 | 1216.5 | 3036 | 2979 | 662.8 |
| A | 8 | 15 | 491184 | 736.55 | 3036 | 2979 | 662.8 |
| A | 0 | 23 | 152507 | 225.59 | 3036 | 2979 | 662.8 |
| B | 0 | 229 | 1731210 | 3033.26 | 3020 | 2945 | 569.8 |
| B | 10 | 245 | 901805 | 1577.58 | 3020 | 2945 | 569.8 |
| B | 0 | 182 | 248289 | 430.6 | 3020 | 2945 | 569.8 |
| C | 3 | 233 | 4384548 | 6826.39 | 2939 | 2912 | 641.9 |
| C | 14 | 234 | 18820 | 24.78 | 2939 | 2912 | 641.9 |
| C | 13 | 61 | 17438 | 22.63 | 2939 | 2912 | 641.9 |
| D | 13 | 122 | 8076639 | 11957.92 | 2902 | 2820 | 675.2 |
| D | 5 | 222 | 2855931 | 4225.67 | 2902 | 2820 | 675.2 |
| D | 12 | 110 | 1804148 | 2667.9 | 2902 | 2820 | 675.2 |
Histogram calculated using DETX and DETY for each event in the final _common_clean file
| Quadrant A |  |
 |
Quadrant B |
|---|---|---|---|
| Quadrant D |  |
 |
Quadrant C |
| Plot type | Count rate plots | Images |
|---|---|---|
| Comparison with Poisson distribution Blue bars denote a histogram of data divided into 1 sec bins. Red curve is a Poisson curve with rate = median count rate of data. |
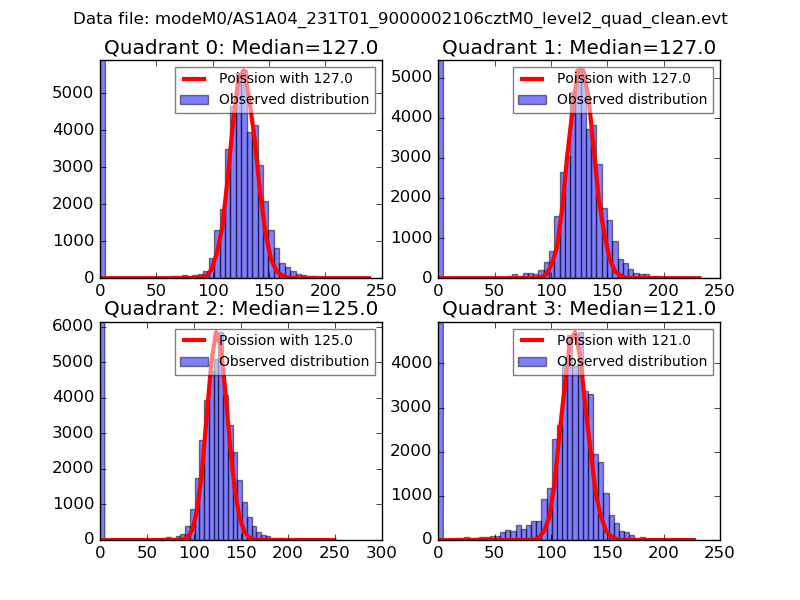 |
 |
| Quadrant-wise count rates Data is divided into 100 sec bins |
 |
|
| Module-wise count rates for Quadrant A Data is divided into 100 sec bins |
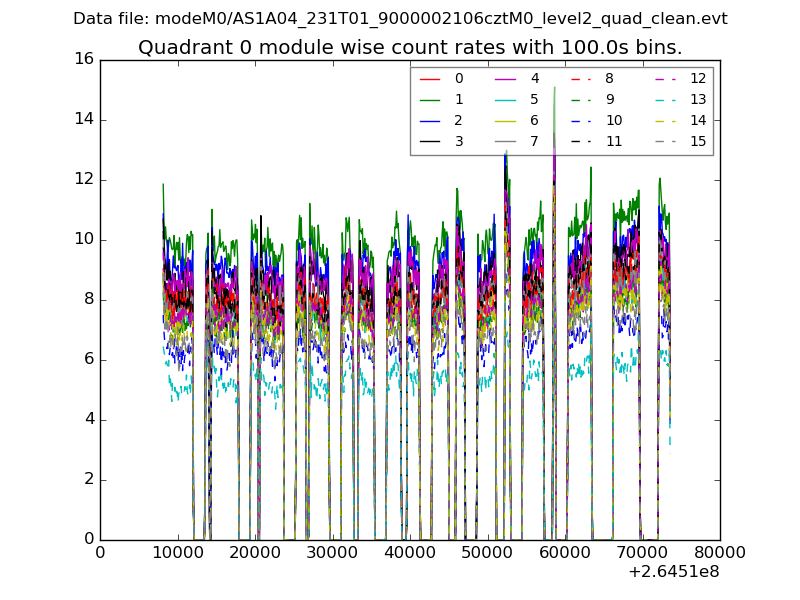 |
 |
| Module-wise count rates for Quadrant B Data is divided into 100 sec bins |
 |
 |
| Module-wise count rates for Quadrant C Data is divided into 100 sec bins |
 |
 |
| Module-wise count rates for Quadrant D Data is divided into 100 sec bins |
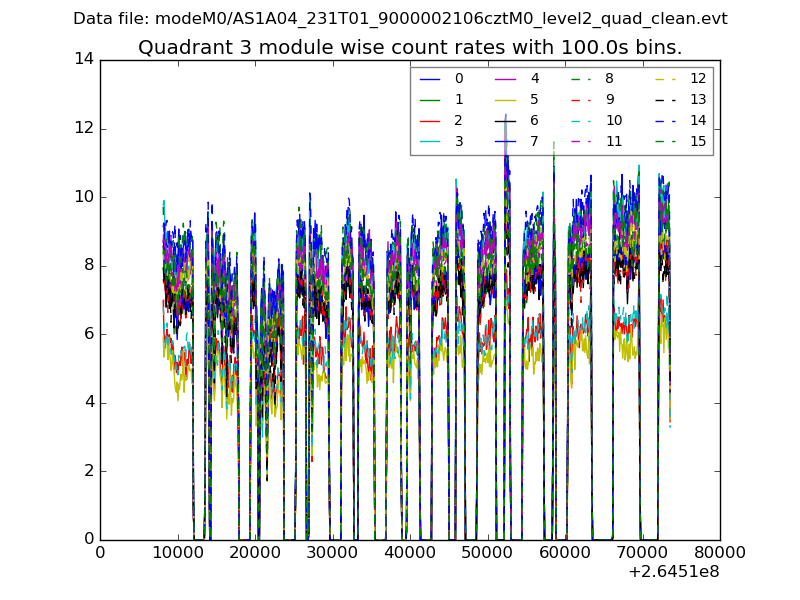 |
 |
| Parameter | Plot |
|---|---|
| CZT HV Monitor | 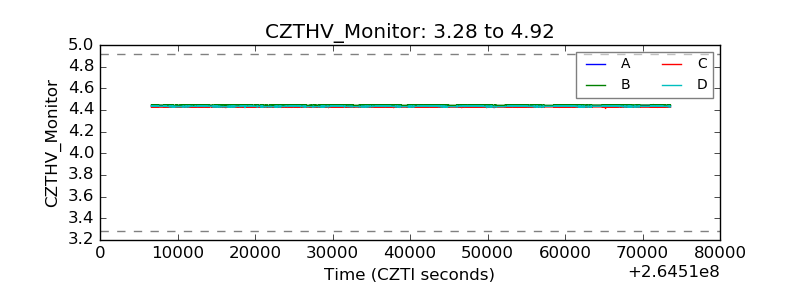 |
| D_VDD |  |
| Temperature 1 |  |
| Veto HV Monitor |  |
| Veto LLD | 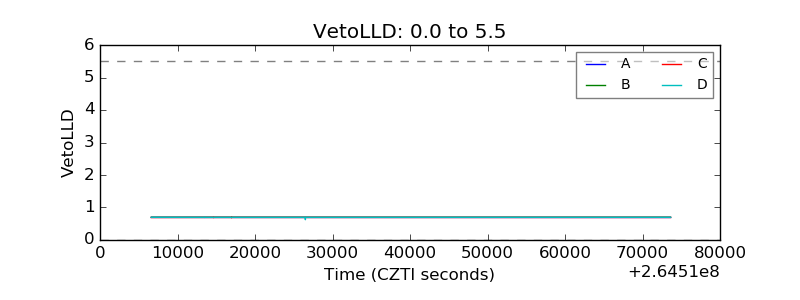 |
| Alpha Counter |  |
| _CPM_Rate |  |
| CZT Counter |  |
| +2.5 Volts monitor |  |
| +5 Volts monitor | 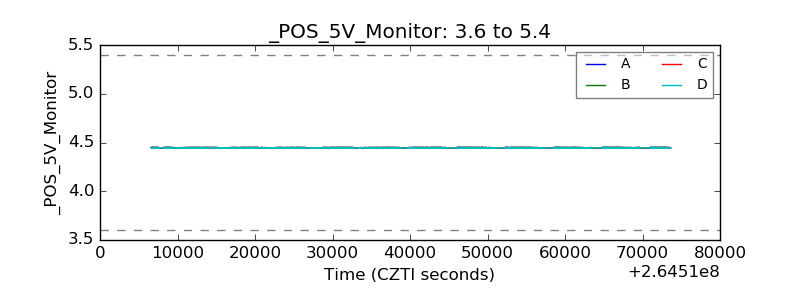 |
| _ROLL_ROT |  |
| _Roll_DEC |  |
| _Roll_RA | 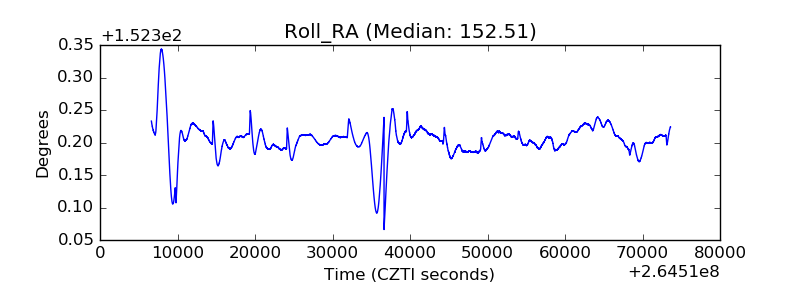 |
| Veto Counter |  |