| Param | Original file | Final file |
|---|---|---|
| Filename | modeM0/AS1G08_014T01_9000002104cztM0_level2_bc.evt | modeM0/AS1G08_014T01_9000002104cztM0_level2_quad_clean.evt |
| Size (bytes) | 8,257,835,520 | 2,478,697,920 |
| Size | 7.7 GB | 2.3 GB |
| Events in quadrant A | 46,057,827 | 16,032,957 |
| Events in quadrant B | 52,963,693 | 15,973,496 |
| Events in quadrant C | 48,836,966 | 15,175,078 |
| Events in quadrant D | 89,026,903 | 14,593,118 |
| Mode M0 | |||
|---|---|---|---|
| Quadrant | BADHDUFLAG | Total packets | Discarded packets |
| A | 0 | 416168 | 0 |
| B | 0 | 449803 | 0 |
| C | 0 | 415647 | 0 |
| D | 0 | 575114 | 0 |
| Mode SS | |||
|---|---|---|---|
| Quadrant | BADHDUFLAG | Total packets | Discarded packets |
| A | 0 | 3952 | 0 |
| B | 0 | 3952 | 0 |
| C | 0 | 3952 | 0 |
| D | 0 | 3952 | 0 |
| Mode M9 | |||
|---|---|---|---|
| Quadrant | BADHDUFLAG | Total packets | Discarded packets |
| A | 0 | 315 | 0 |
| B | 0 | 315 | 0 |
| C | 0 | 315 | 0 |
| D | 0 | 315 | 0 |
| Quadrant | Total seconds | Saturated seconds | Saturation percentage |
|---|---|---|---|
| A | 194221 | 2439 | 1.255786% |
| B | 194221 | 5983 | 3.080511% |
| C | 194221 | 1674 | 0.861905% |
| D | 194220 | 12623 | 6.499331% |
Noise dominated data is calculated using 1-second bins in cleaned event files. If a bin has >2000 counts, and if more than 50% of those come from <1% of pixels, then it is considered to be noise-dominated and hence unusable.
| Quadrant | # 1 sec bins | Bins with >0 counts | Bins with >2000 counts | High rate bins dominated by noise | Noise dominated (total time) | Noise dominated (detector-on time) | Marked lightcurve |
|---|---|---|---|---|---|---|---|
| A | 227384 | 194232 | 17 | 17 | 0.01% | 0.01% |  |
| B | 227384 | 194227 | 222 | 222 | 0.10% | 0.11% |  |
| C | 227384 | 194230 | 7 | 7 | 0.00% | 0.00% |  |
| D | 227384 | 194224 | 1997 | 1997 | 0.88% | 1.03% |  |
Top three noisy pixels from each quadrant. If the there are fewer than three noisy pixels in the level2.evt file, extra rows are filled as -1
| Pixel properties | Quadrant properties | ||||||
|---|---|---|---|---|---|---|---|
| Quadrant | DetID | PixID | Counts | Sigma | Mean | Median | Sigma |
| A | 12 | 189 | 2323528 | 1029.99 | 10439 | 10256 | 2245.9 |
| A | 8 | 15 | 1951816 | 864.48 | 10439 | 10256 | 2245.9 |
| A | 0 | 23 | 945346 | 416.35 | 10439 | 10256 | 2245.9 |
| B | 0 | 229 | 4795793 | 2491.45 | 10323 | 10072 | 1920.9 |
| B | 10 | 245 | 3073062 | 1594.6 | 10323 | 10072 | 1920.9 |
| B | 0 | 182 | 2400238 | 1244.32 | 10323 | 10072 | 1920.9 |
| C | 3 | 233 | 9707687 | 4427.41 | 9958 | 9824 | 2190.4 |
| C | 6 | 96 | 81459 | 32.7 | 9958 | 9824 | 2190.4 |
| C | 14 | 234 | 64058 | 24.76 | 9958 | 9824 | 2190.4 |
| D | 5 | 222 | 15347772 | 6750.86 | 9897 | 9633 | 2272.0 |
| D | 13 | 122 | 13260938 | 5832.37 | 9897 | 9633 | 2272.0 |
| D | 8 | 195 | 8500952 | 3737.33 | 9897 | 9633 | 2272.0 |
Histogram calculated using DETX and DETY for each event in the final _common_clean file
| Quadrant A | 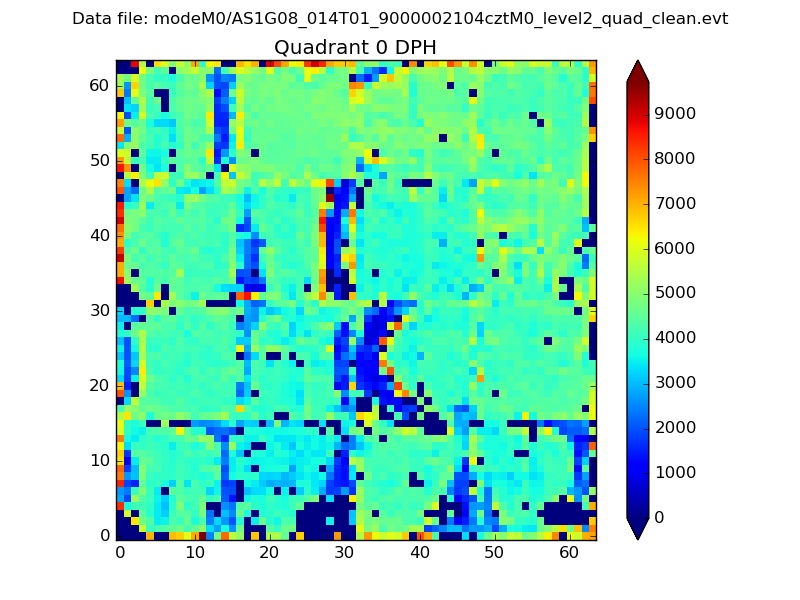 |
 |
Quadrant B |
|---|---|---|---|
| Quadrant D | 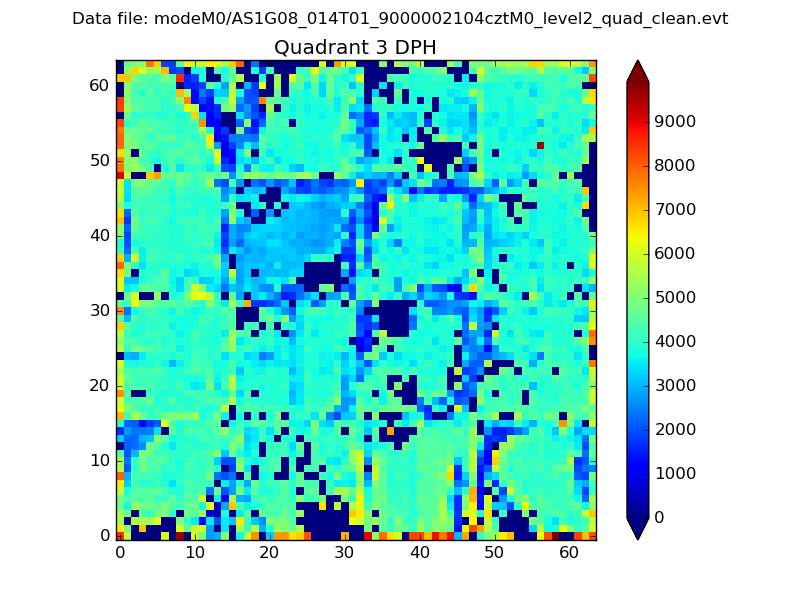 |
 |
Quadrant C |
| Plot type | Count rate plots | Images |
|---|---|---|
| Comparison with Poisson distribution Blue bars denote a histogram of data divided into 1 sec bins. Red curve is a Poisson curve with rate = median count rate of data. |
 |
 |
| Quadrant-wise count rates Data is divided into 100 sec bins |
 |
|
| Module-wise count rates for Quadrant A Data is divided into 100 sec bins |
 |
 |
| Module-wise count rates for Quadrant B Data is divided into 100 sec bins |
 |
 |
| Module-wise count rates for Quadrant C Data is divided into 100 sec bins |
 |
 |
| Module-wise count rates for Quadrant D Data is divided into 100 sec bins |
 |
 |
| Parameter | Plot |
|---|---|
| CZT HV Monitor | 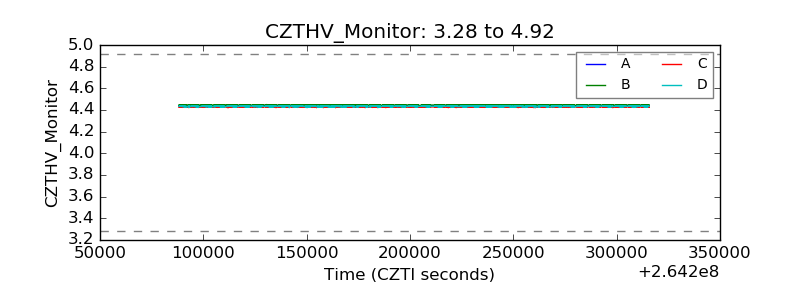 |
| D_VDD |  |
| Temperature 1 | 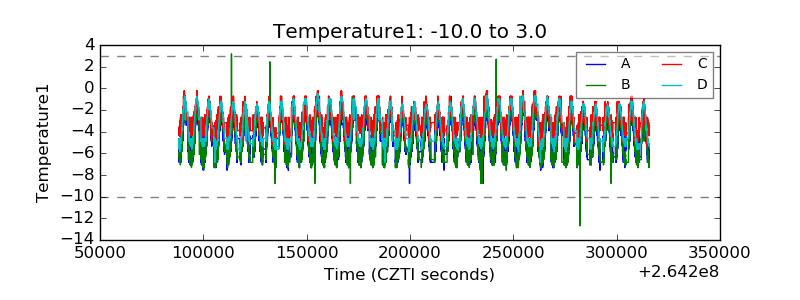 |
| Veto HV Monitor | 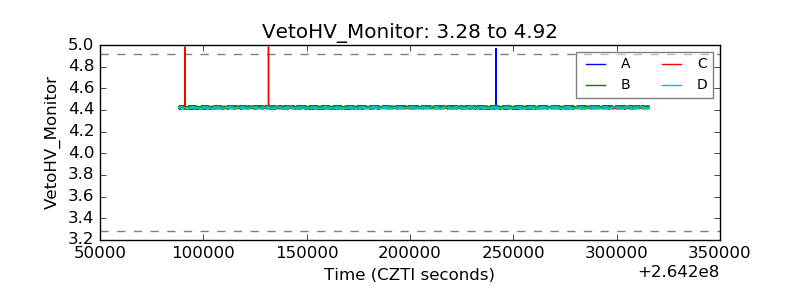 |
| Veto LLD |  |
| Alpha Counter |  |
| _CPM_Rate |  |
| CZT Counter |  |
| +2.5 Volts monitor |  |
| +5 Volts monitor |  |
| _ROLL_ROT |  |
| _Roll_DEC | 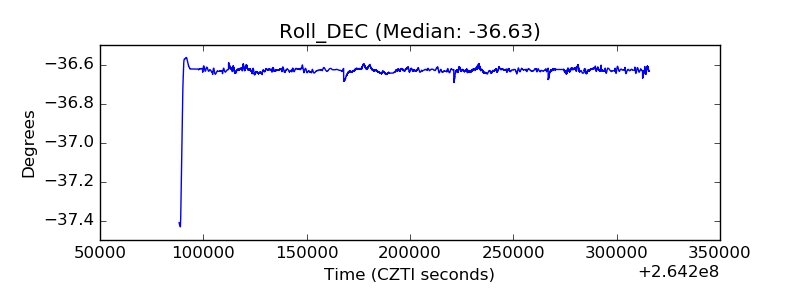 |
| _Roll_RA | 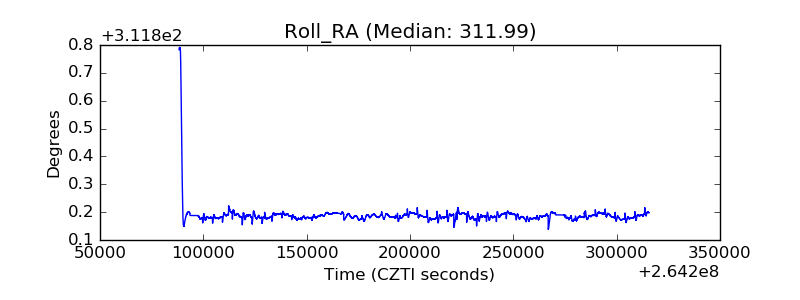 |
| Veto Counter | 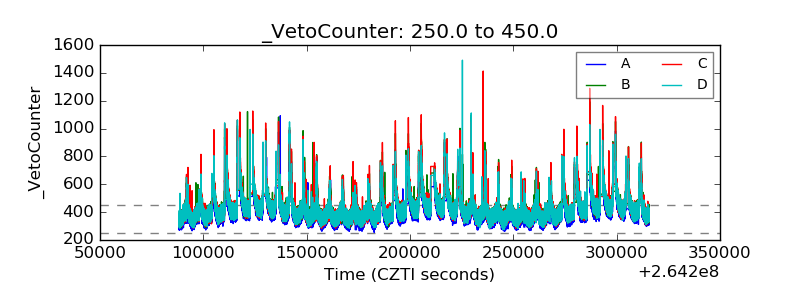 |