| Param | Original file | Final file |
|---|---|---|
| Filename | modeM0/AS1G08_084T01_9000002100cztM0_level2_bc.evt | modeM0/AS1G08_084T01_9000002100cztM0_level2_quad_clean.evt |
| Size (bytes) | 5,281,683,840 | 1,928,759,040 |
| Size | 4.9 GB | 1.8 GB |
| Events in quadrant A | 28,665,653 | 12,760,307 |
| Events in quadrant B | 33,814,137 | 12,818,179 |
| Events in quadrant C | 32,455,064 | 12,405,336 |
| Events in quadrant D | 56,423,359 | 11,777,545 |
| Mode M9 | |||
|---|---|---|---|
| Quadrant | BADHDUFLAG | Total packets | Discarded packets |
| A | 0 | 211 | 0 |
| B | 0 | 211 | 0 |
| C | 0 | 211 | 0 |
| D | 0 | 212 | 0 |
| Mode M0 | |||
|---|---|---|---|
| Quadrant | BADHDUFLAG | Total packets | Discarded packets |
| A | 0 | 264424 | 0 |
| B | 0 | 284713 | 0 |
| C | 0 | 272633 | 0 |
| D | 0 | 362377 | 0 |
| Mode SS | |||
|---|---|---|---|
| Quadrant | BADHDUFLAG | Total packets | Discarded packets |
| A | 0 | 2580 | 0 |
| B | 0 | 2580 | 0 |
| C | 0 | 2580 | 0 |
| D | 0 | 2580 | 0 |
| Quadrant | Total seconds | Saturated seconds | Saturation percentage |
|---|---|---|---|
| A | 126406 | 1332 | 1.053747% |
| B | 126414 | 3118 | 2.466499% |
| C | 126410 | 1146 | 0.906574% |
| D | 126401 | 7203 | 5.698531% |
Noise dominated data is calculated using 1-second bins in cleaned event files. If a bin has >2000 counts, and if more than 50% of those come from <1% of pixels, then it is considered to be noise-dominated and hence unusable.
| Quadrant | # 1 sec bins | Bins with >0 counts | Bins with >2000 counts | High rate bins dominated by noise | Noise dominated (total time) | Noise dominated (detector-on time) | Marked lightcurve |
|---|---|---|---|---|---|---|---|
| A | 148055 | 126419 | 13 | 13 | 0.01% | 0.01% |  |
| B | 148055 | 126421 | 170 | 170 | 0.11% | 0.13% |  |
| C | 148055 | 126421 | 5 | 5 | 0.00% | 0.00% |  |
| D | 148055 | 126419 | 1756 | 1756 | 1.19% | 1.39% |  |
Top three noisy pixels from each quadrant. If the there are fewer than three noisy pixels in the level2.evt file, extra rows are filled as -1
| Pixel properties | Quadrant properties | ||||||
|---|---|---|---|---|---|---|---|
| Quadrant | DetID | PixID | Counts | Sigma | Mean | Median | Sigma |
| A | 12 | 189 | 1115927 | 761.94 | 6749 | 6647 | 1455.9 |
| A | 8 | 15 | 966581 | 659.36 | 6749 | 6647 | 1455.9 |
| A | 9 | 143 | 192229 | 127.47 | 6749 | 6647 | 1455.9 |
| B | 0 | 229 | 1811215 | 1403.37 | 6766 | 6602 | 1285.9 |
| B | 0 | 182 | 1732875 | 1342.45 | 6766 | 6602 | 1285.9 |
| B | 4 | 97 | 993861 | 767.75 | 6766 | 6602 | 1285.9 |
| C | 3 | 233 | 6629666 | 4554.76 | 6557 | 6490 | 1454.1 |
| C | 14 | 234 | 96489 | 61.89 | 6557 | 6490 | 1454.1 |
| C | 0 | 207 | 54905 | 33.29 | 6557 | 6490 | 1454.1 |
| D | 5 | 222 | 8768149 | 5831.08 | 6438 | 6268 | 1502.6 |
| D | 8 | 195 | 7682701 | 5108.71 | 6438 | 6268 | 1502.6 |
| D | 12 | 110 | 6443027 | 4283.7 | 6438 | 6268 | 1502.6 |
Histogram calculated using DETX and DETY for each event in the final _common_clean file
| Quadrant A | 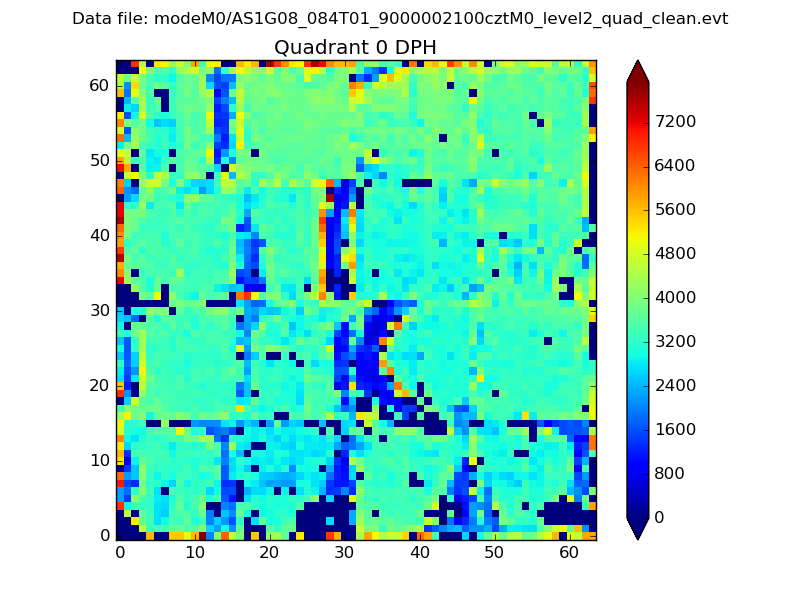 |
 |
Quadrant B |
|---|---|---|---|
| Quadrant D |  |
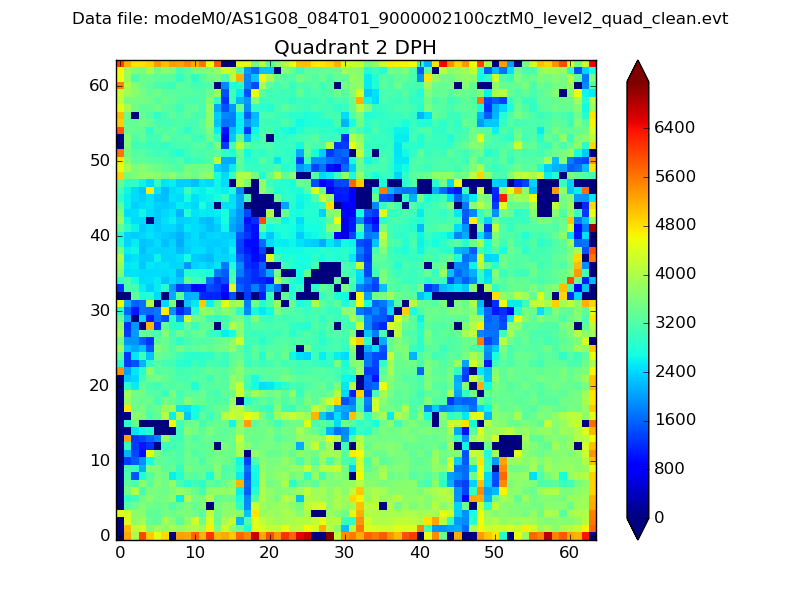 |
Quadrant C |
| Plot type | Count rate plots | Images |
|---|---|---|
| Comparison with Poisson distribution Blue bars denote a histogram of data divided into 1 sec bins. Red curve is a Poisson curve with rate = median count rate of data. |
 |
 |
| Quadrant-wise count rates Data is divided into 100 sec bins |
 |
|
| Module-wise count rates for Quadrant A Data is divided into 100 sec bins |
 |
 |
| Module-wise count rates for Quadrant B Data is divided into 100 sec bins |
 |
 |
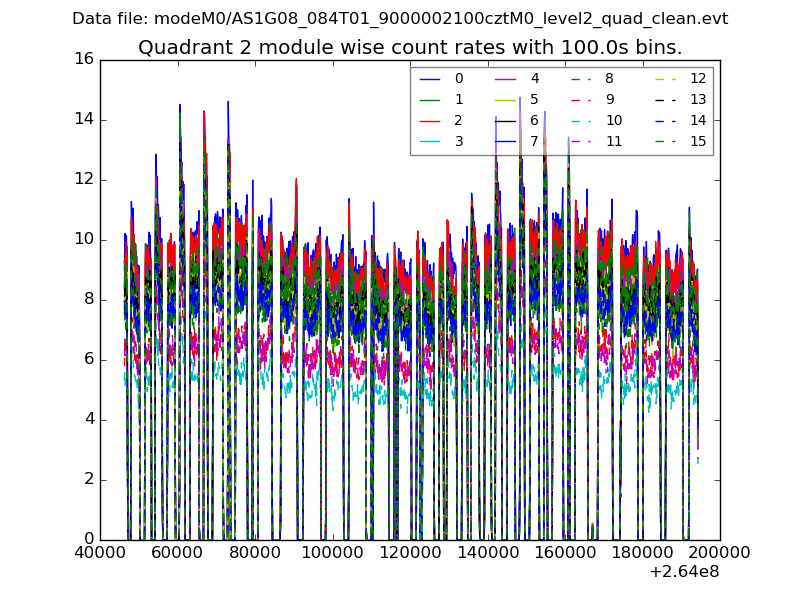
| Module-wise count rates for Quadrant C Data is divided into 100 sec bins |
 |
 |
| Module-wise count rates for Quadrant D Data is divided into 100 sec bins |
 |
 |
| Parameter | Plot |
|---|---|
| CZT HV Monitor | 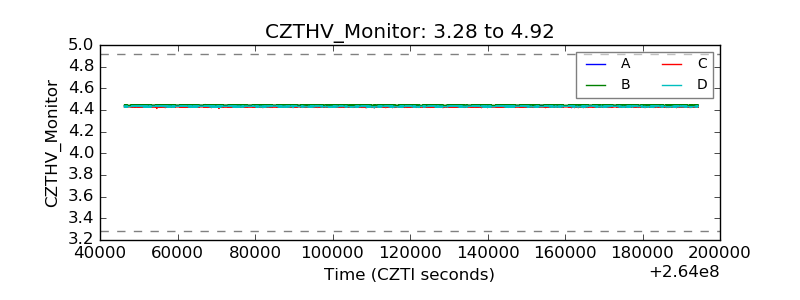 |
| D_VDD | 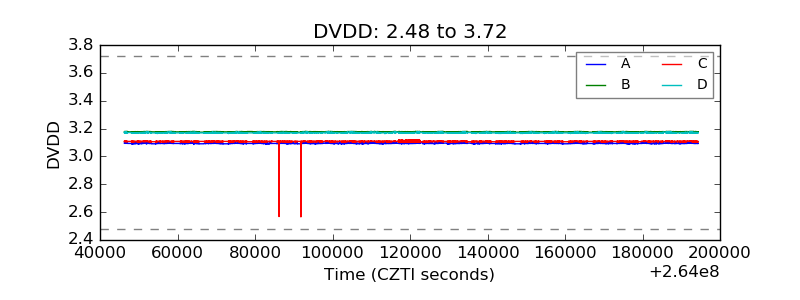 |
| Temperature 1 |  |
| Veto HV Monitor |  |
| Veto LLD |  |
| Alpha Counter |  |
| _CPM_Rate | 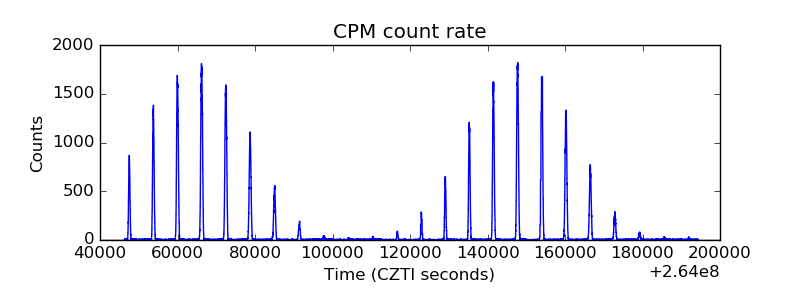 |
| CZT Counter |  |
| +2.5 Volts monitor |  |
| +5 Volts monitor | 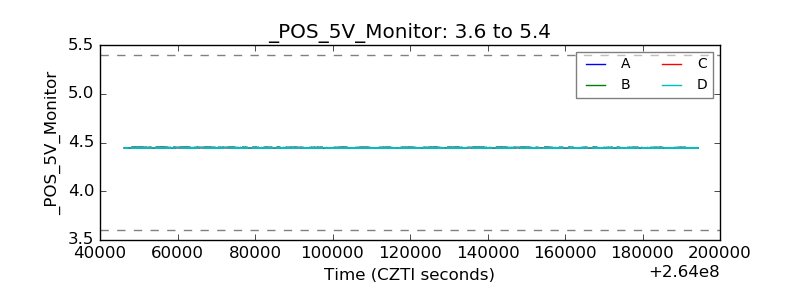 |
| _ROLL_ROT | 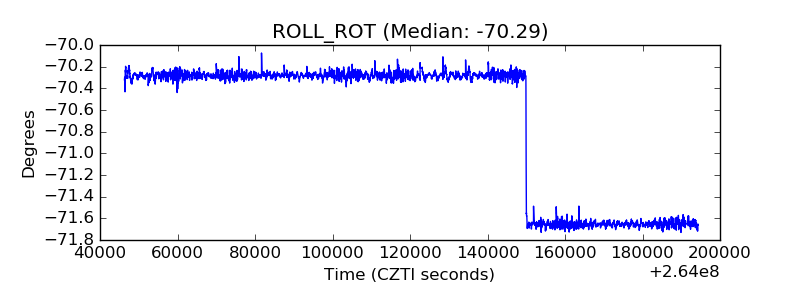 |
| _Roll_DEC |  |
| _Roll_RA |  |
| Veto Counter |  |