| Param | Original file | Final file |
|---|---|---|
| Filename | modeM0/AS1C03_022T01_9000002098cztM0_level2_bc.evt | modeM0/AS1C03_022T01_9000002098cztM0_level2_quad_clean.evt |
| Size (bytes) | 3,202,945,920 | 940,746,240 |
| Size | 3.0 GB | 897.2 MB |
| Events in quadrant A | 18,117,188 | 6,030,837 |
| Events in quadrant B | 22,812,396 | 5,973,108 |
| Events in quadrant C | 18,161,211 | 5,770,704 |
| Events in quadrant D | 32,717,945 | 5,491,280 |
| Mode M0 | |||
|---|---|---|---|
| Quadrant | BADHDUFLAG | Total packets | Discarded packets |
| A | 0 | 163717 | 0 |
| B | 0 | 189145 | 0 |
| C | 0 | 161115 | 0 |
| D | 0 | 224810 | 0 |
| Mode SS | |||
|---|---|---|---|
| Quadrant | BADHDUFLAG | Total packets | Discarded packets |
| A | 0 | 1546 | 0 |
| B | 0 | 1546 | 0 |
| C | 0 | 1546 | 0 |
| D | 0 | 1546 | 0 |
| Mode M9 | |||
|---|---|---|---|
| Quadrant | BADHDUFLAG | Total packets | Discarded packets |
| A | 0 | 122 | 0 |
| B | 0 | 122 | 0 |
| C | 0 | 122 | 0 |
| D | 0 | 122 | 0 |
| Quadrant | Total seconds | Saturated seconds | Saturation percentage |
|---|---|---|---|
| A | 76258 | 909 | 1.192006% |
| B | 76258 | 3973 | 5.209945% |
| C | 76258 | 645 | 0.845813% |
| D | 76258 | 6719 | 8.810879% |
Noise dominated data is calculated using 1-second bins in cleaned event files. If a bin has >2000 counts, and if more than 50% of those come from <1% of pixels, then it is considered to be noise-dominated and hence unusable.
| Quadrant | # 1 sec bins | Bins with >0 counts | Bins with >2000 counts | High rate bins dominated by noise | Noise dominated (total time) | Noise dominated (detector-on time) | Marked lightcurve |
|---|---|---|---|---|---|---|---|
| A | 88229 | 76264 | 20 | 20 | 0.02% | 0.03% |  |
| B | 88229 | 76261 | 59 | 59 | 0.07% | 0.08% | 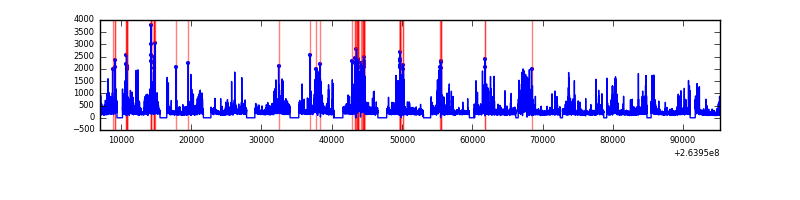 |
| C | 88229 | 76262 | 1 | 1 | 0.00% | 0.00% | 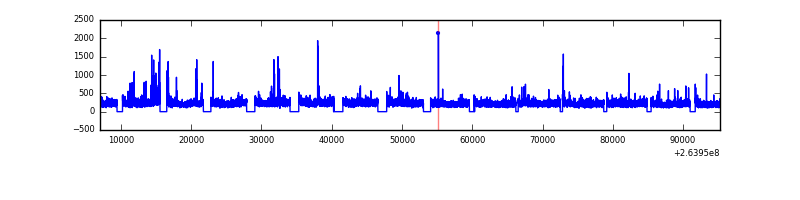 |
| D | 88229 | 76259 | 588 | 588 | 0.67% | 0.77% |  |
Top three noisy pixels from each quadrant. If the there are fewer than three noisy pixels in the level2.evt file, extra rows are filled as -1
| Pixel properties | Quadrant properties | ||||||
|---|---|---|---|---|---|---|---|
| Quadrant | DetID | PixID | Counts | Sigma | Mean | Median | Sigma |
| A | 8 | 15 | 1403954 | 1595.49 | 4046 | 3967 | 877.5 |
| A | 12 | 189 | 462712 | 522.81 | 4046 | 3967 | 877.5 |
| A | 9 | 143 | 408492 | 461.01 | 4046 | 3967 | 877.5 |
| B | 0 | 182 | 3938534 | 5207.51 | 3940 | 3826 | 755.6 |
| B | 10 | 245 | 637061 | 838.07 | 3940 | 3826 | 755.6 |
| B | 4 | 97 | 522588 | 686.57 | 3940 | 3826 | 755.6 |
| C | 3 | 233 | 2995194 | 3598.71 | 3829 | 3774 | 831.2 |
| C | 0 | 207 | 137481 | 160.85 | 3829 | 3774 | 831.2 |
| C | 13 | 61 | 22732 | 22.81 | 3829 | 3774 | 831.2 |
| D | 13 | 122 | 4148650 | 4602.96 | 3771 | 3656 | 900.5 |
| D | 5 | 222 | 3699099 | 4103.74 | 3771 | 3656 | 900.5 |
| D | 10 | 157 | 2730308 | 3027.91 | 3771 | 3656 | 900.5 |
Histogram calculated using DETX and DETY for each event in the final _common_clean file
| Quadrant A |  |
 |
Quadrant B |
|---|---|---|---|
| Quadrant D |  |
 |
Quadrant C |
| Plot type | Count rate plots | Images |
|---|---|---|
| Comparison with Poisson distribution Blue bars denote a histogram of data divided into 1 sec bins. Red curve is a Poisson curve with rate = median count rate of data. |
 |
 |
| Quadrant-wise count rates Data is divided into 100 sec bins |
 |
|
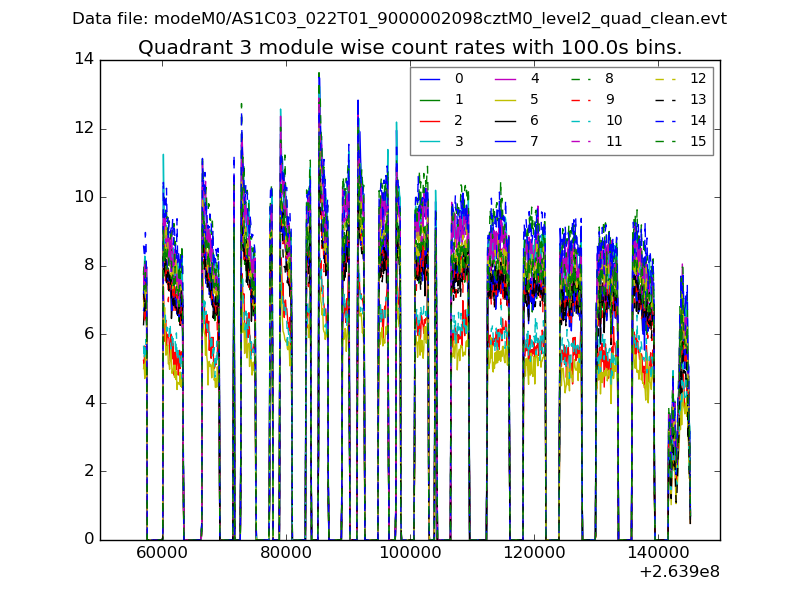
| Module-wise count rates for Quadrant A Data is divided into 100 sec bins |
 |
 |
| Module-wise count rates for Quadrant B Data is divided into 100 sec bins |
 |
 |
| Module-wise count rates for Quadrant C Data is divided into 100 sec bins |
 |
 |
| Module-wise count rates for Quadrant D Data is divided into 100 sec bins |
 |
 |
| Parameter | Plot |
|---|---|
| CZT HV Monitor | 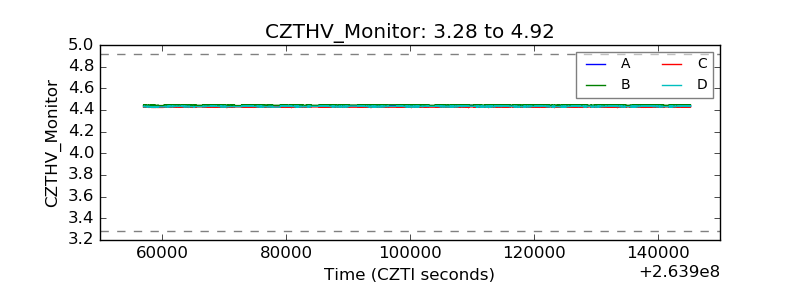 |
| D_VDD | 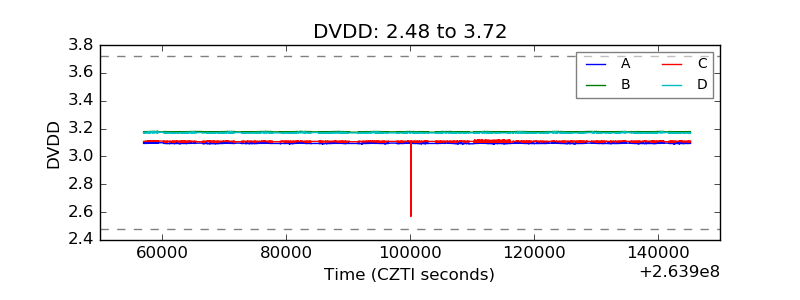 |
| Temperature 1 | 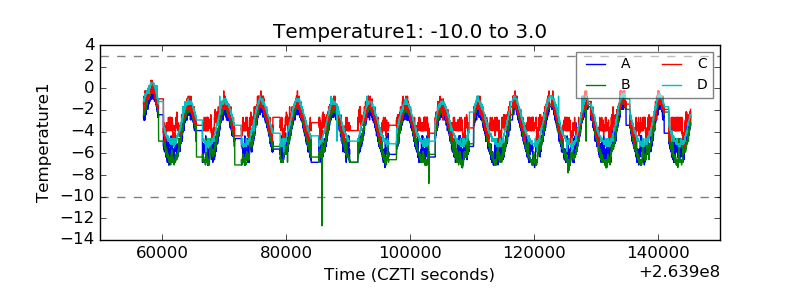 |
| Veto HV Monitor | 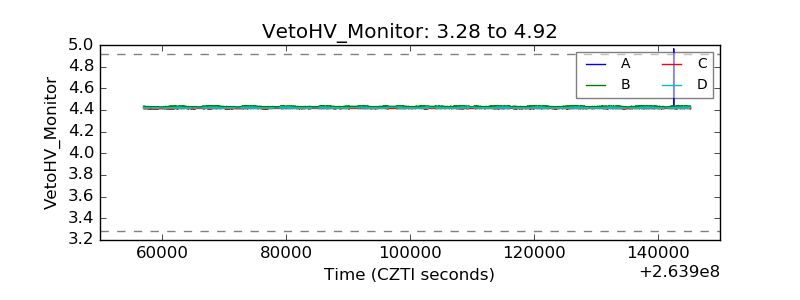 |
| Veto LLD |  |
| Alpha Counter |  |
| _CPM_Rate |  |
| CZT Counter |  |
| +2.5 Volts monitor |  |
| +5 Volts monitor |  |
| _ROLL_ROT |  |
| _Roll_DEC |  |
| _Roll_RA | 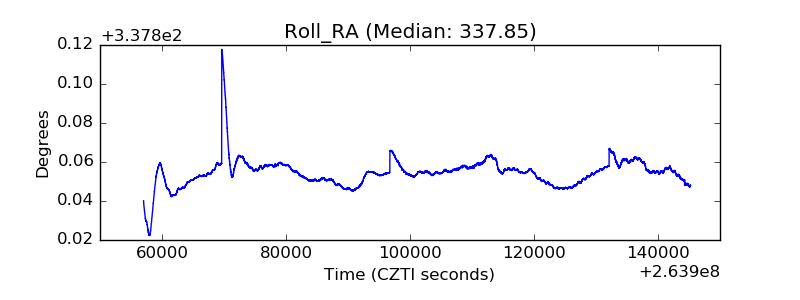 |
| Veto Counter | 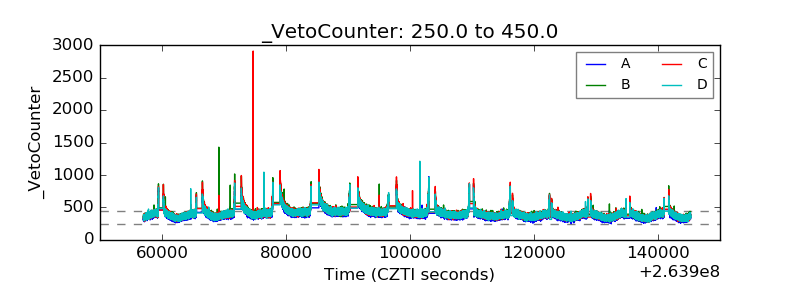 |