| Param | Original file | Final file |
|---|---|---|
| Filename | modeM0/AS1G08_024T02_9000002094cztM0_level2_bc.evt | modeM0/AS1G08_024T02_9000002094cztM0_level2_quad_clean.evt |
| Size (bytes) | 1,657,644,480 | 575,593,920 |
| Size | 1.5 GB | 548.9 MB |
| Events in quadrant A | 9,320,741 | 3,564,914 |
| Events in quadrant B | 13,296,885 | 3,566,154 |
| Events in quadrant C | 10,247,631 | 3,766,123 |
| Events in quadrant D | 14,425,322 | 3,605,538 |
| Mode SS | |||
|---|---|---|---|
| Quadrant | BADHDUFLAG | Total packets | Discarded packets |
| A | 0 | 866 | 0 |
| B | 0 | 866 | 0 |
| C | 0 | 866 | 0 |
| D | 0 | 866 | 0 |
| Mode M0 | |||
|---|---|---|---|
| Quadrant | BADHDUFLAG | Total packets | Discarded packets |
| A | 0 | 89655 | 0 |
| B | 0 | 105601 | 0 |
| C | 0 | 89870 | 0 |
| D | 0 | 105389 | 0 |
| Mode M9 | |||
|---|---|---|---|
| Quadrant | BADHDUFLAG | Total packets | Discarded packets |
| A | 0 | 96 | 0 |
| B | 0 | 96 | 0 |
| C | 0 | 96 | 0 |
| D | 0 | 96 | 0 |
| Quadrant | Total seconds | Saturated seconds | Saturation percentage |
|---|---|---|---|
| A | 42716 | 606 | 1.418672% |
| B | 42718 | 1974 | 4.621003% |
| C | 42718 | 472 | 1.104921% |
| D | 42718 | 611 | 1.430310% |
Noise dominated data is calculated using 1-second bins in cleaned event files. If a bin has >2000 counts, and if more than 50% of those come from <1% of pixels, then it is considered to be noise-dominated and hence unusable.
| Quadrant | # 1 sec bins | Bins with >0 counts | Bins with >2000 counts | High rate bins dominated by noise | Noise dominated (total time) | Noise dominated (detector-on time) | Marked lightcurve |
|---|---|---|---|---|---|---|---|
| A | 51513 | 42718 | 0 | 0 | 0.00% | 0.00% |  |
| B | 51514 | 42719 | 60 | 60 | 0.12% | 0.14% | 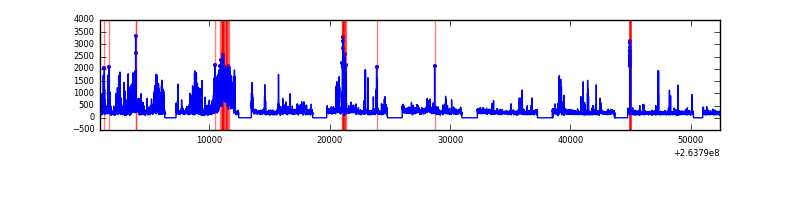 |
| C | 51513 | 42719 | 1 | 1 | 0.00% | 0.00% |  |
| D | 51513 | 42719 | 28 | 28 | 0.05% | 0.07% |  |
Top three noisy pixels from each quadrant. If the there are fewer than three noisy pixels in the level2.evt file, extra rows are filled as -1
| Pixel properties | Quadrant properties | ||||||
|---|---|---|---|---|---|---|---|
| Quadrant | DetID | PixID | Counts | Sigma | Mean | Median | Sigma |
| A | 12 | 189 | 143320 | 276.53 | 2359 | 2313 | 509.9 |
| A | 8 | 15 | 85048 | 162.25 | 2359 | 2313 | 509.9 |
| A | 9 | 143 | 43052 | 79.89 | 2359 | 2313 | 509.9 |
| B | 0 | 85 | 3494813 | 8000.68 | 2351 | 2291 | 436.5 |
| B | 10 | 244 | 594619 | 1356.91 | 2351 | 2291 | 436.5 |
| B | 0 | 219 | 52399 | 114.79 | 2351 | 2291 | 436.5 |
| C | 3 | 233 | 890268 | 1693.23 | 2381 | 2354 | 524.4 |
| C | 5 | 193 | 19486 | 32.67 | 2381 | 2354 | 524.4 |
| C | 5 | 96 | 15735 | 25.52 | 2381 | 2354 | 524.4 |
| D | 8 | 195 | 2958315 | 5501.61 | 2363 | 2299 | 537.3 |
| D | 1 | 52 | 1775853 | 3300.86 | 2363 | 2299 | 537.3 |
| D | 7 | 254 | 181360 | 333.26 | 2363 | 2299 | 537.3 |
Histogram calculated using DETX and DETY for each event in the final _common_clean file
| Quadrant A |  |
 |
Quadrant B |
|---|---|---|---|
| Quadrant D |  |
 |
Quadrant C |
| Plot type | Count rate plots | Images |
|---|---|---|
| Comparison with Poisson distribution Blue bars denote a histogram of data divided into 1 sec bins. Red curve is a Poisson curve with rate = median count rate of data. |
 |
 |
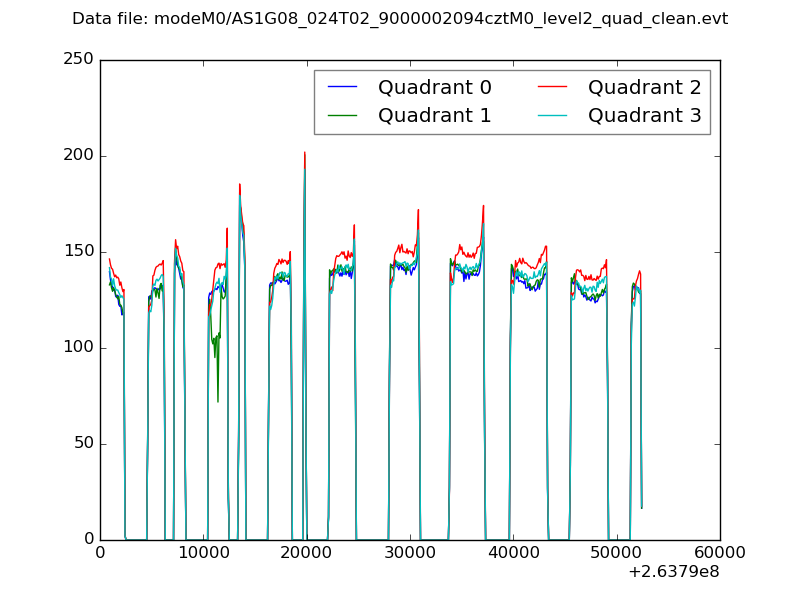
| Quadrant-wise count rates Data is divided into 100 sec bins |
 |
|
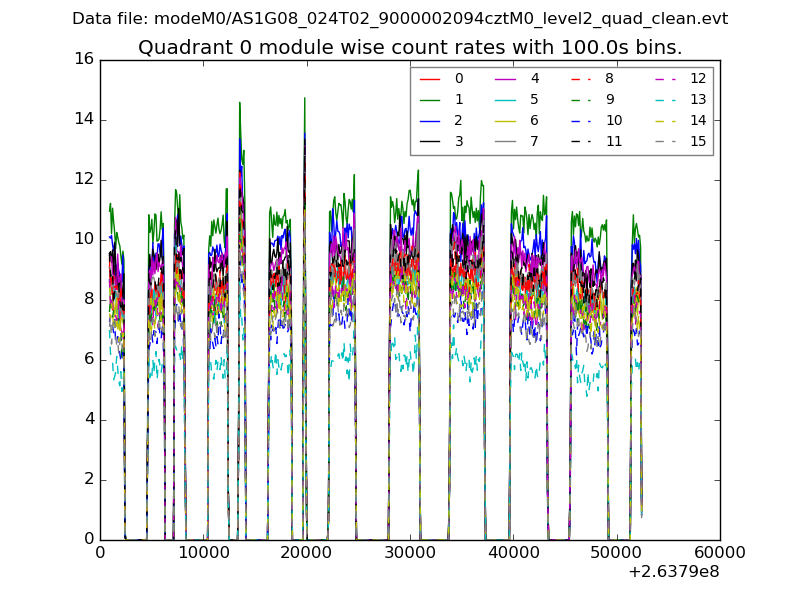
| Module-wise count rates for Quadrant A Data is divided into 100 sec bins |
 |
 |
| Module-wise count rates for Quadrant B Data is divided into 100 sec bins |
 |
 |
| Module-wise count rates for Quadrant C Data is divided into 100 sec bins |
 |
 |
| Module-wise count rates for Quadrant D Data is divided into 100 sec bins |
 |
 |
| Parameter | Plot |
|---|---|
| CZT HV Monitor |  |
| D_VDD |  |
| Temperature 1 |  |
| Veto HV Monitor |  |
| Veto LLD | 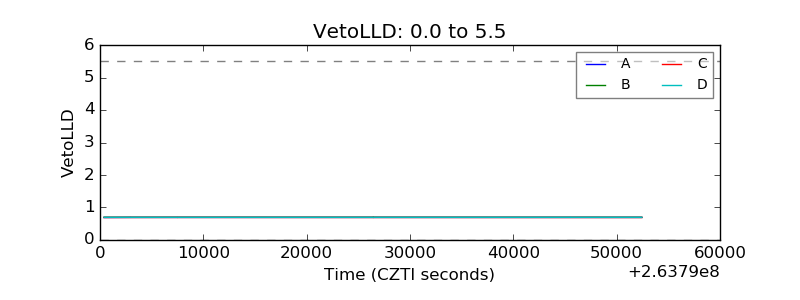 |
| Alpha Counter |  |
| _CPM_Rate |  |
| CZT Counter |  |
| +2.5 Volts monitor |  |
| +5 Volts monitor | 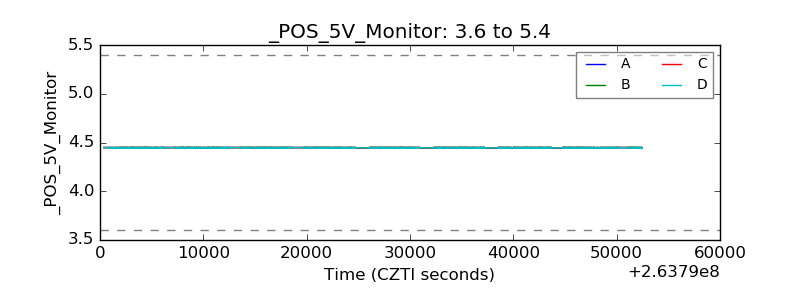 |
| _ROLL_ROT |  |
| _Roll_DEC | 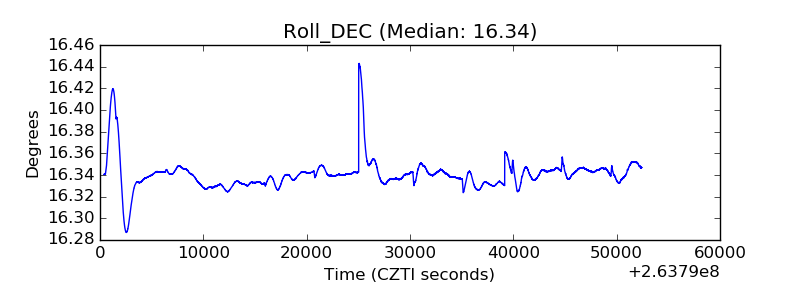 |
| _Roll_RA | 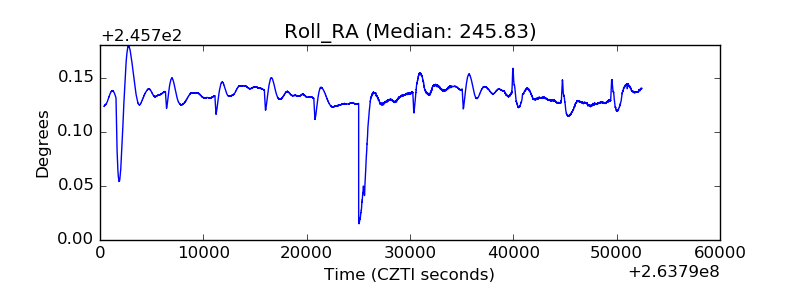 |
| Veto Counter |  |